

Why a snack company, a flag company, a furniture company, and a fitness rower shouldn’t share a marketing strategy, and the system we use to make sure they don’t.
Jun 17, 2026
I’ve scaled DTC brands across every vertical you can name. $30-AOV supplements. $5,000 fitness rowers. 8-SKU beauty brands. 8,000-SKU furniture catalogs.
And before I start working with these brands, I hear the same story over and over again:
A snack company implements the same strategies as a furniture company.
A boutique apparel brand gets the same channel mix as a $5,000 AOV jewelry brand.
A 10-SKU supplement brand gets pitched the same SEO strategy as a 600-SKU luxury purse brand.
The agency calls it “best practices.” The brand thinks it’s “scaling.” Six months later, the spend is up, the revenue is flat, and the founder is wondering why the pitch on the sales call didn’t work.
Thousands of agencies and marketers fall into this trap because they think its a world of B2B and B2C. E-Comm vs lead gen. You specialize in ecomm and you can scale any ecomm brand.
Why isn’t anyone talking about this when it comes to ecomm? The playbook that scales a $30-AOV supplement brand is structurally incompatible with the playbook that scales a $3,000-AOV fitness rower. Not “slightly different.” Not “you have to tweak it.” Structurally incompatible. Different KPIs, different channel mix, different creative cadence, different attribution windows, different tech stack, different team structure.
This is why I built the 4-Quadrant Ecommerce System.
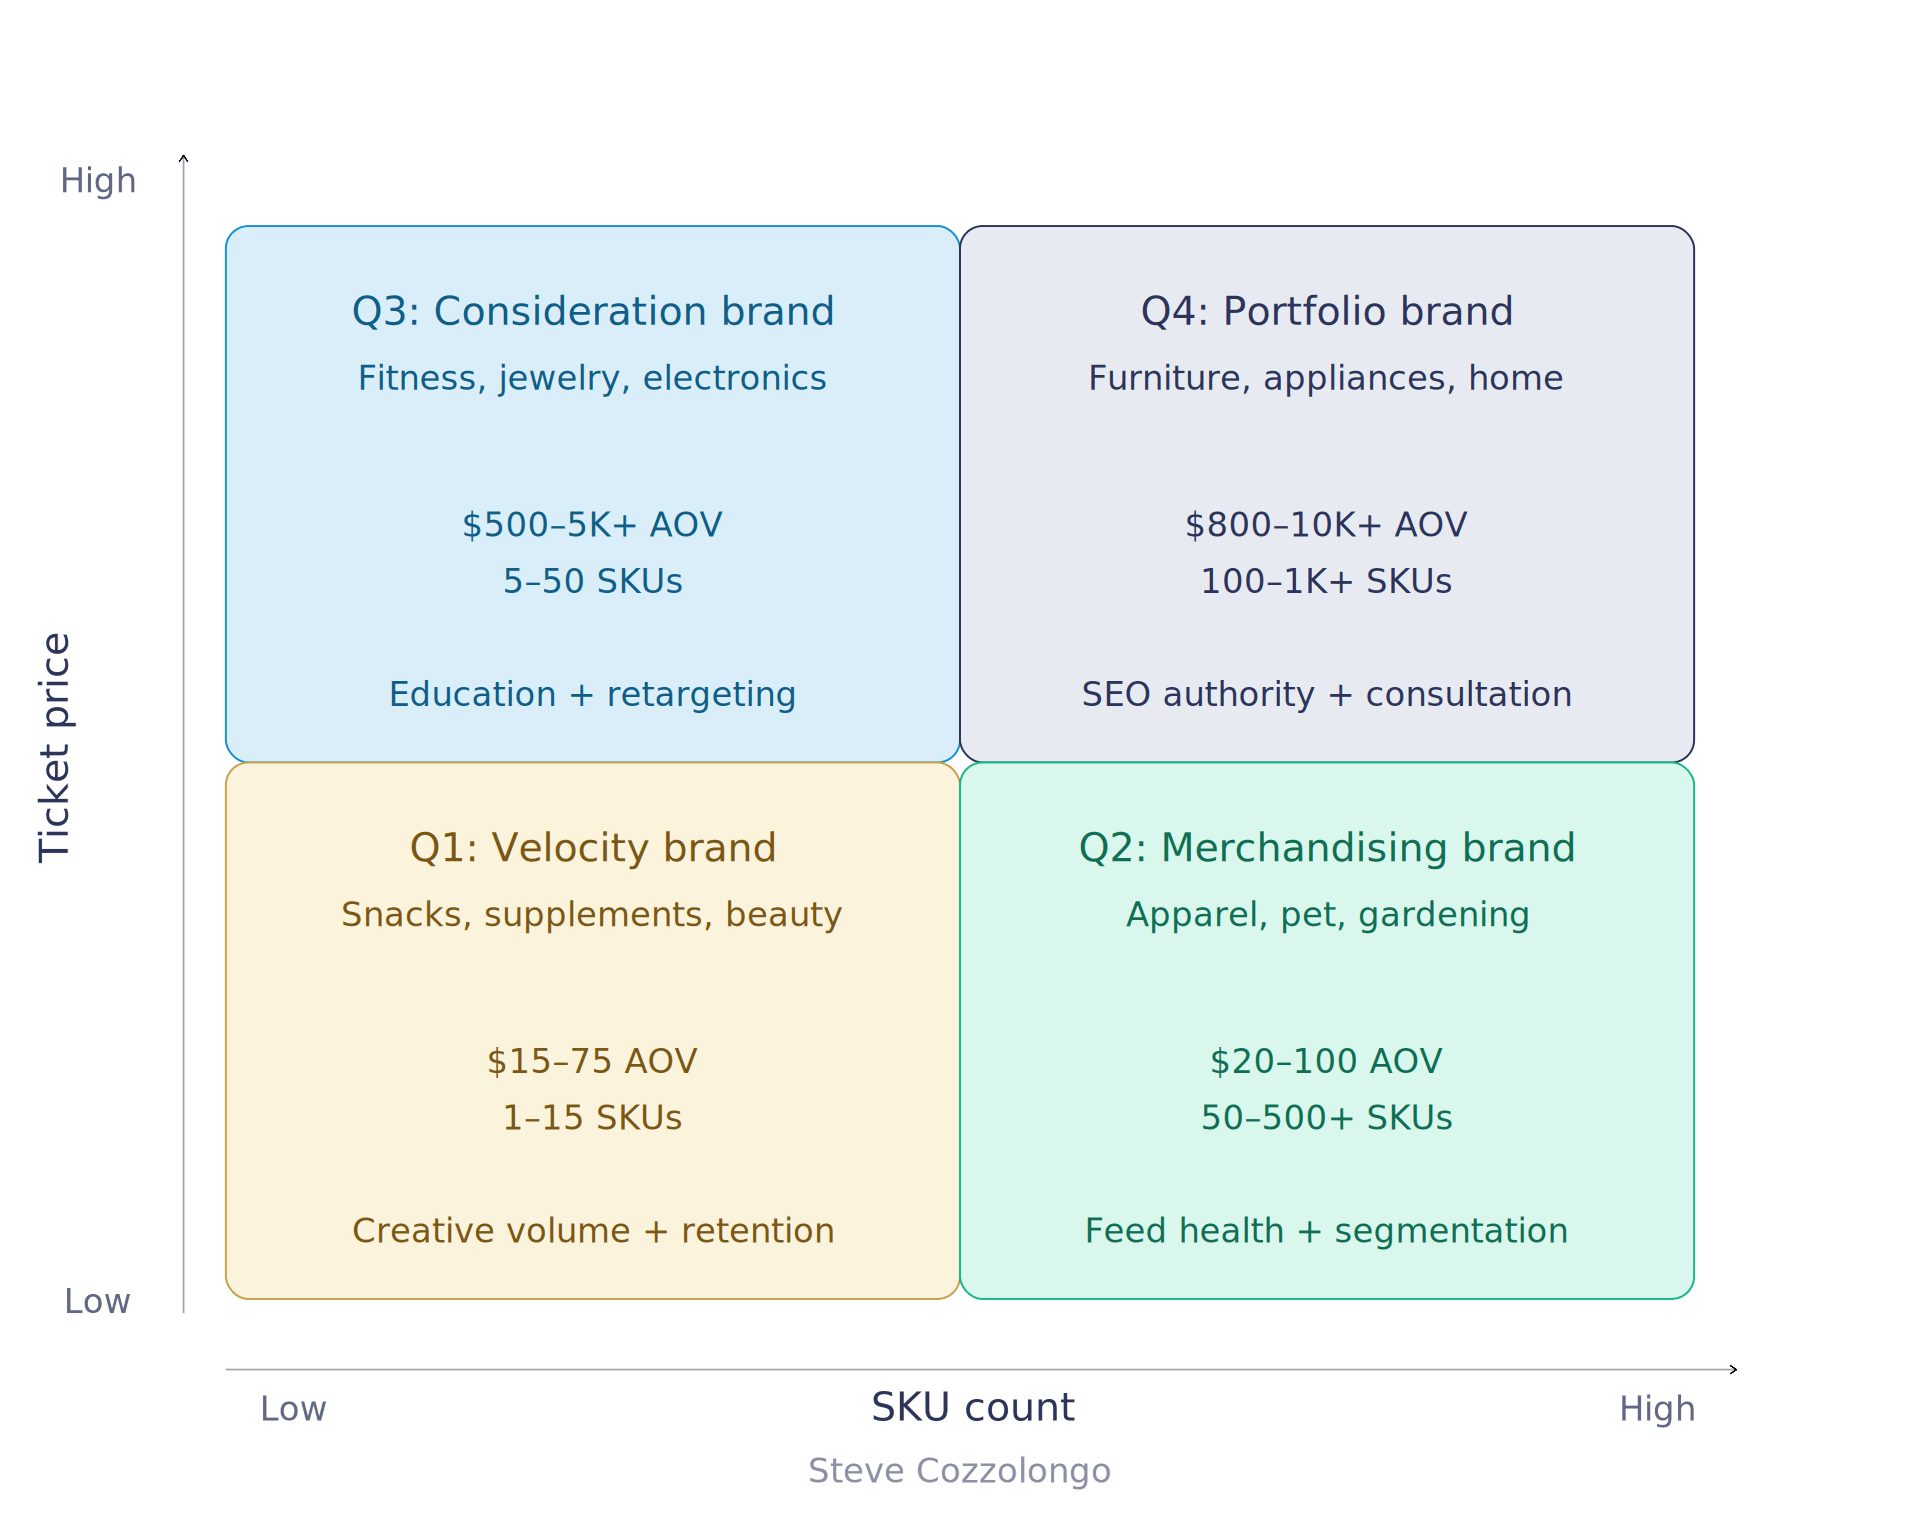
Two variables. Four quadrants. Four fundamentally different growth systems.
This article walks through what each quadrant looks like, the system that scales it, and why getting the diagnosis right is the single highest-leverage decision a founder makes before they hire their next agency.
Why two variables decide everything
The two axes aren’t arbitrary. They’re the two variables that control almost every other decision a brand has to make:
Ticket price decides your sales cycle, attribution window, and trust requirements.
A $40 product is an impulse buy. The customer sees the ad, considers for 30 seconds, decides on instinct. Your attribution window is 1-7 days. Your creative needs to stop the scroll and close the sale at the same time.
A $4,000 product is a research project. The customer sees the ad, then visits 3 times over 30 days, reads a buyer’s guide, watches a YouTube comparison, asks a friend, gets reassured by the financing option, and finally pulls the trigger. Your attribution window is 30-90 days. Your creative needs to educate, build trust, and earn a place in a long deliberation.
Same ad strategy across both? Nah, but you can see why claiming you’re an ecomm growth hacker without explaining this difference can be misleading.
SKU count decides your catalog complexity, channel mix, and merchandising mechanics.
A 10-SKU brand can win on creative testing alone. Every product gets attention. Every PDP gets optimized. Every customer journey is simple.
A 5,000-SKU brand can’t win on creative alone. There’s too many variables and the customer experience is way more complicated. They have to win on feed health, collection structure, and cross-sell mechanics. How consistent is your branding and how are you showing up on every marketplace? Which products and what content are more profitable on which channels?
How you analyze profitability for a low SKU subscription brand with LTV won’t work for the strict CPAs by product category on a high SKU brand.
Two axes and four quadrants. Each one needs its own “best practices”. If you don’t realize this, you probably aren’t growing the way you hoped for.
Quadrant 1: The velocity brand (low ticket / low SKU)
Profile: $15-75 AOV, 1-15 SKUs. Snacks, supplements, single-product beauty, consumables.
Core challenge: You need high volume plus strong retention to scale profitably. Margin per order is thin. The math only works if customers come back.
Growth driver: Creative testing velocity plus retention marketing.
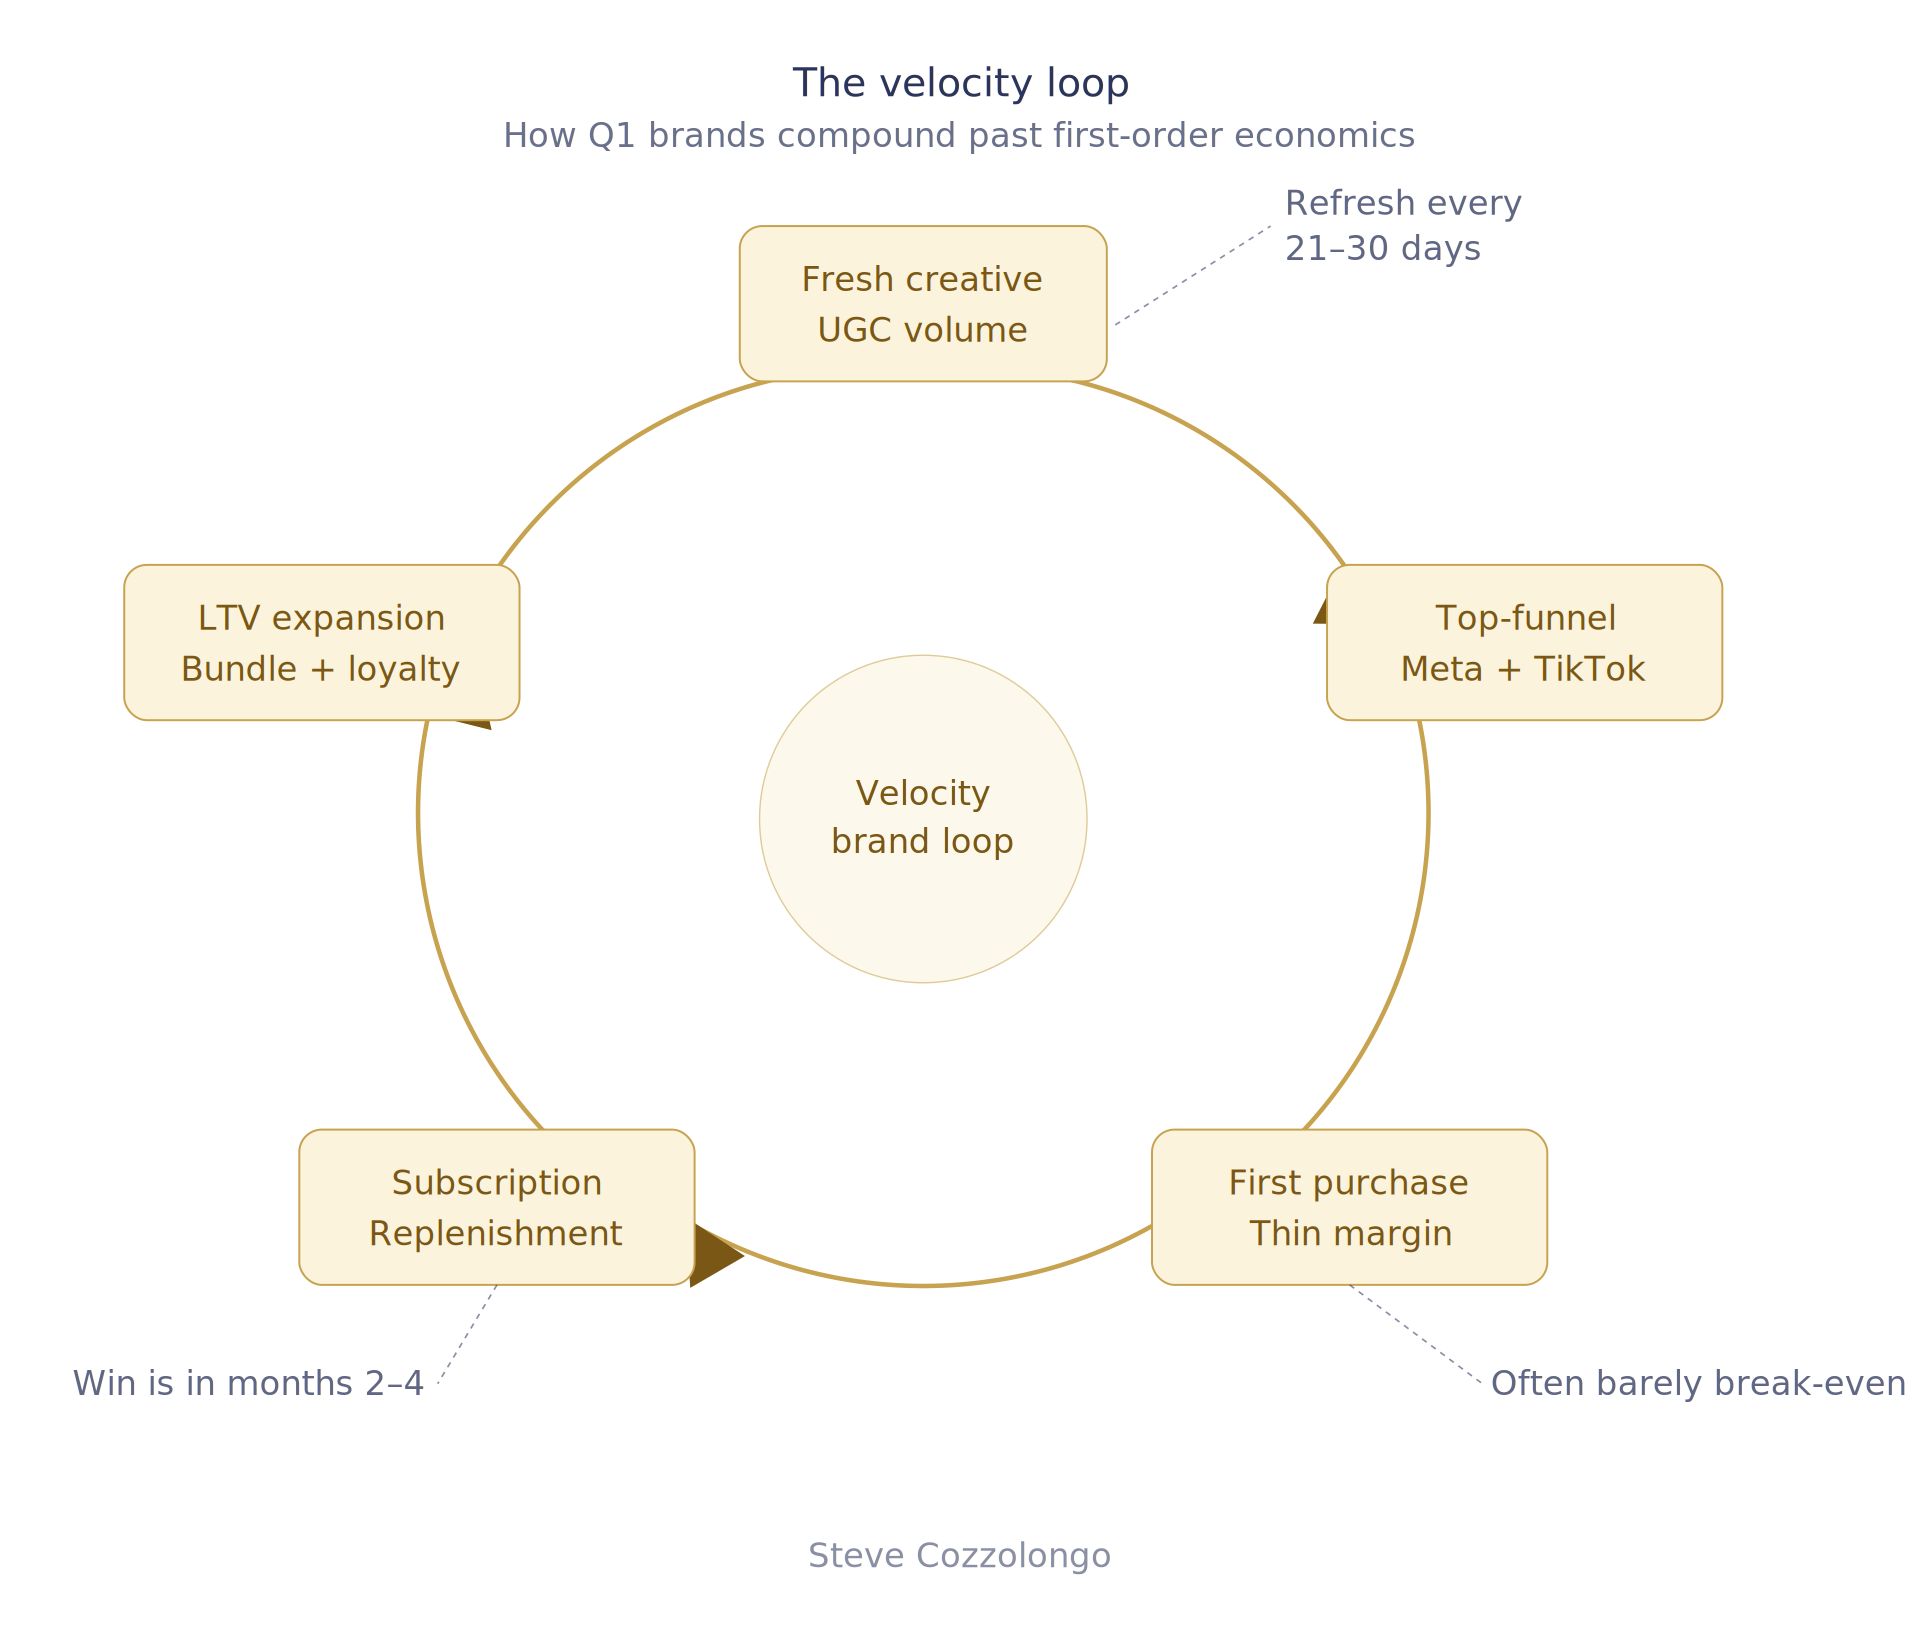
The math here is brutal at the unit level and beautiful AF at the cohort level.
A typical velocity brand’s first-time customer P&L is barely break-even, sometimes negative. Some brands chase profit too early on the acquisition. The money is in the second purchase, the third purchase, the subscription conversion, the bundle upsell, the loyalty tier they enter in month four.
If retention isn’t built before scale, scale will eat the brand alive.
That changes how you build the entire system:
KPIs that matter: LTV:CAC ratio, repeat purchase rate within 90 days, creative refresh cycle, subscription adoption rate.
KPIs that don’t: Single-purchase ROAS, last-click attribution, AOV expansion (it’s already capped by product price).
Channel mix: Meta 50-60%, Google Shopping 15-20%, Google Search 10-15%, TikTok 10-15% (sometimes more). Velocity brands skew heavily into social discovery because the impulse-buy mechanic works there.
Creative cadence: 20-30 new video assets per 30-day sprint. UGC-heavy, scroll-stopping, refreshed every 21-30 days because creative fatigues fast at high frequency.
The retention infrastructure that has to exist Day 1: subscription flow, replenishment reminders, post-purchase upsell, loyalty program, win-back sequence. If retention isn’t built before scale, scale will eat the brand alive.
Tech stack signature: Recharge or Stay AI (subscriptions), Smile.io or LoyaltyLion (loyalty), Klaviyo (email/SMS), Triple Whale (attribution), Yotpo (reviews).
The brands we see fail at this quadrant fail one of two ways. Either they over-invest in acquisition before retention is built (and burn cash chasing customers who never come back), or they under-invest in creative volume (and watch nCAC climb for months while they wait for “the next winner ad” to land).
The fix is treating creative as a supply chain, not a campaign. The brands hitting MER targets in this quadrant aren’t producing the best ads. They’re producing the most ads, often from multiple source and formats.
Quadrant 2: The merchandising brand (low ticket / high SKU)
Profile: $20-100 AOV, 50-500+ SKUs. Apparel, pet supplies, gardening products, accessories.
Core challenge: Managing product variety while maintaining CAC efficiency. You can’t manually optimize 500 product pages. You can’t run dedicated creative for every SKU. You need systems that scale with the catalog.
Growth driver: Feed optimization plus product segmentation plus cross-sell.
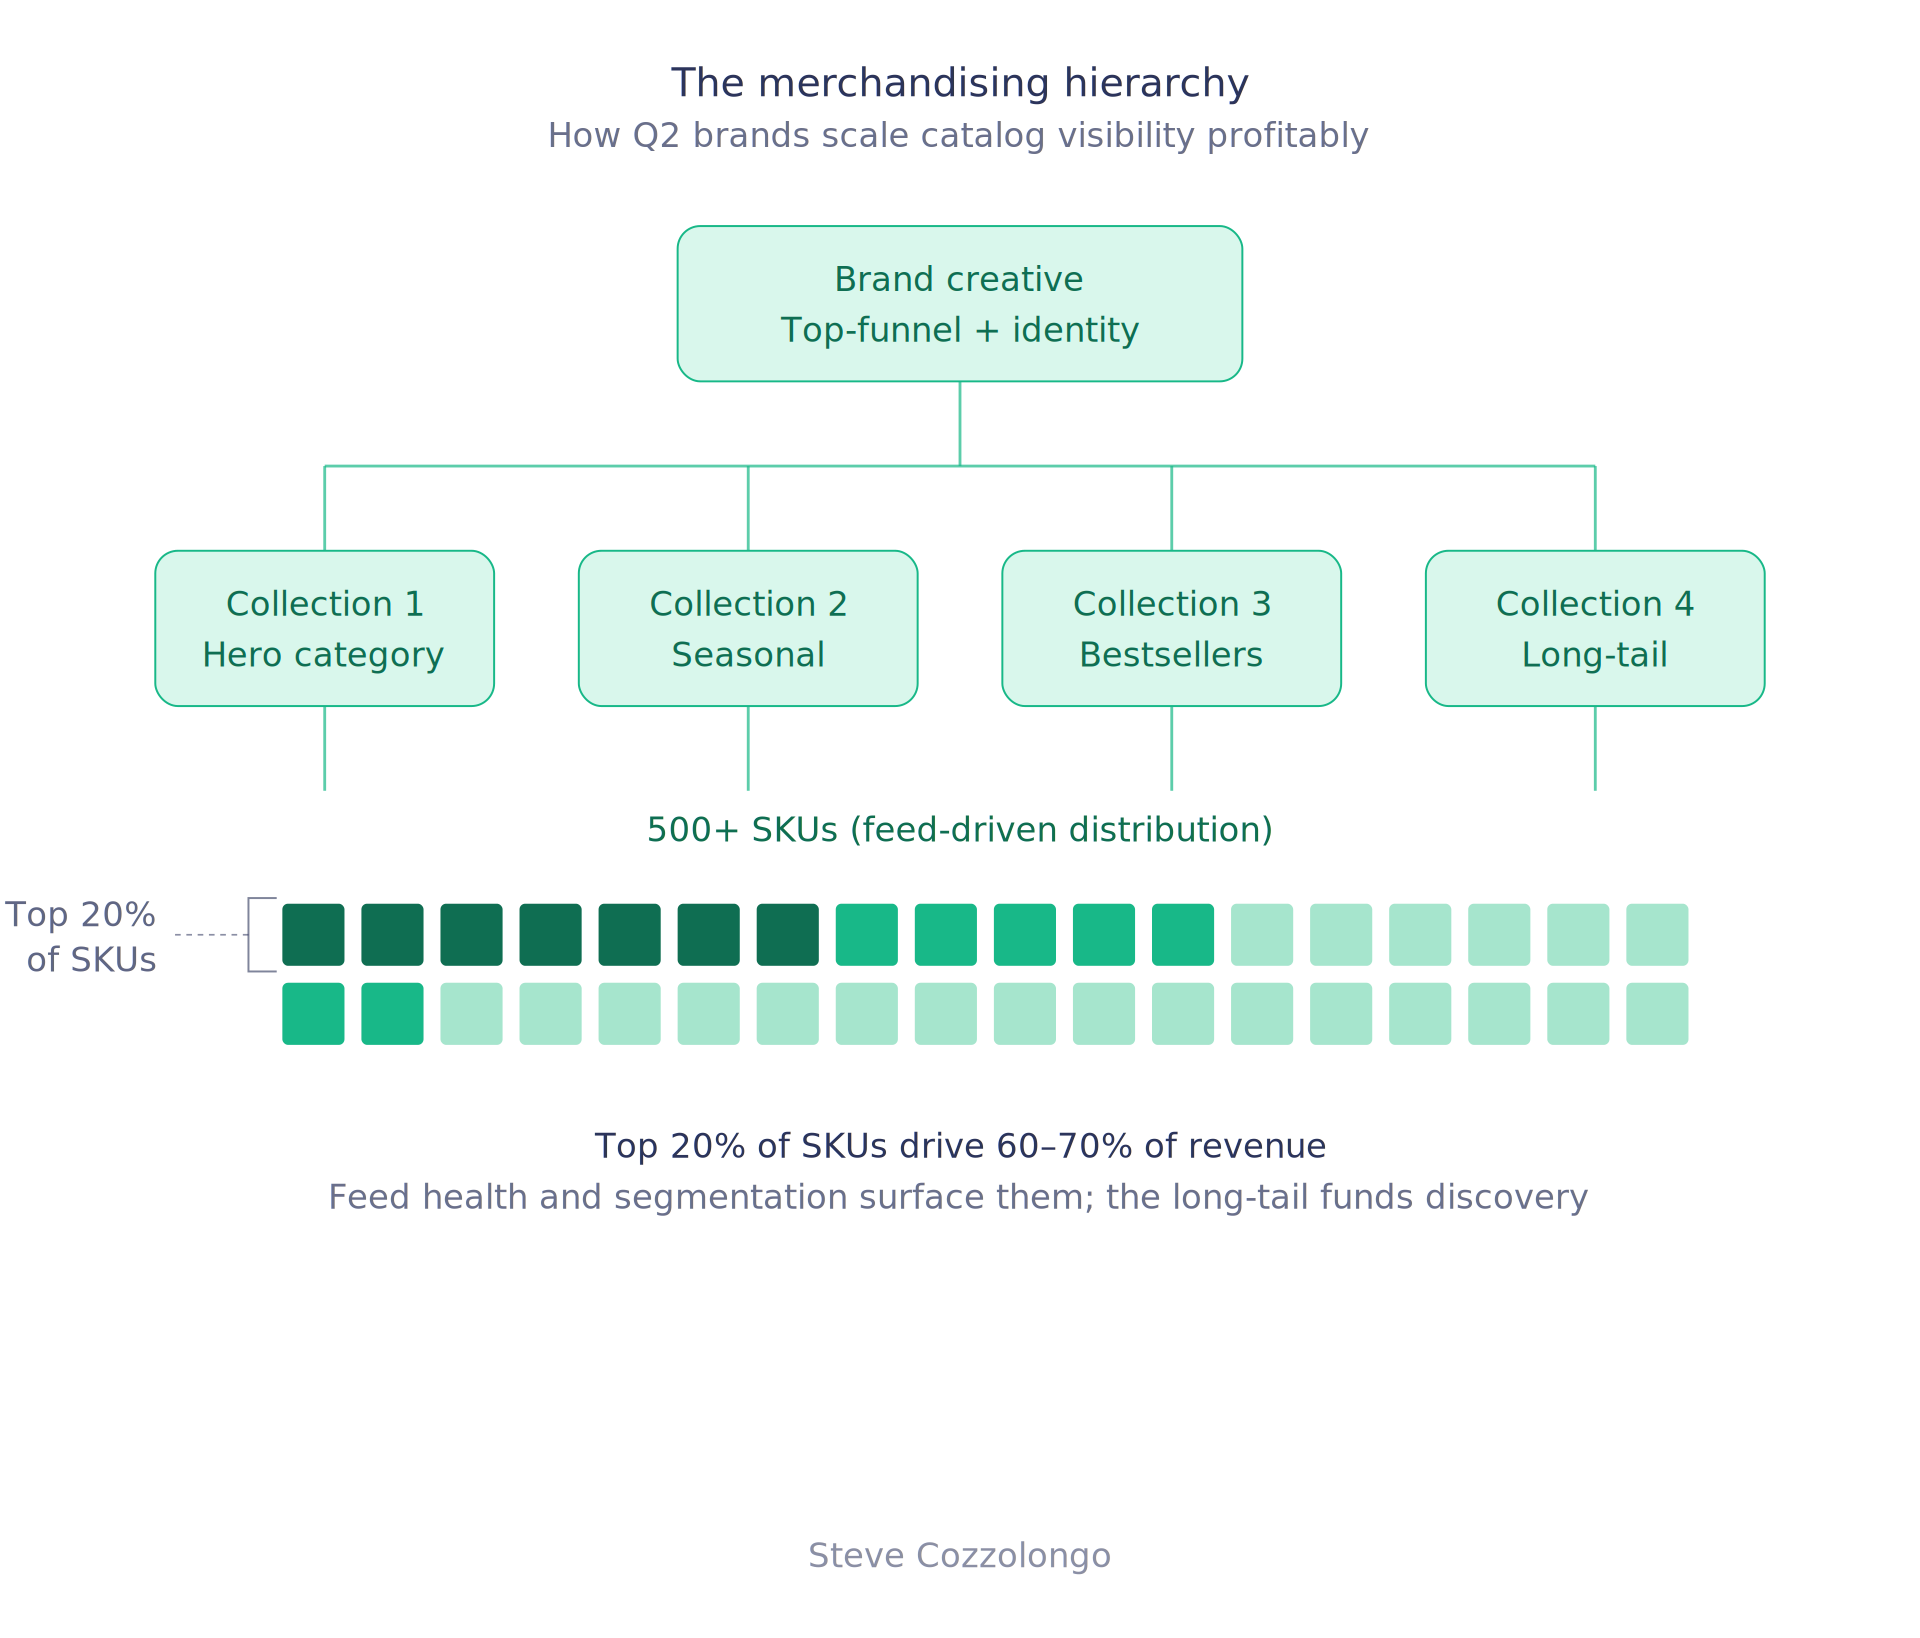
The merchandising brand wins on a different math entirely. Single-creative ROAS isn’t the lever. The lever is what percentage of your catalog is profitably visible to a buyer who’s ready to act.
We’ve watched this play out at a brand new flag company. The brand had been running for years without breaking through to consistent profitability. Multiple categories of products, traditional Google-heavy approach, and barely attempting Meta with mid-tier (if that) creative.
The shift came when we treated it as a Q2 brand instead of trying to force a Q1 playbook:
- Buyer personas got mapped through OuterSignal so we knew who was actually converting – validating buyer personas
- 20+ static creatives plus 6 video creatives (per month) produced specifically for collection-level merchandising
- SEO content became a primary channel (organic revenue doubling month-over-month)
- Feed health became a weekly KPI, not a one and done set up
- Strategic partnership testing layered on top (one coordinated influencer drop produced a $65K day)
In March 2026, they hit their best month ever, beating June 2025 (their previous peak) while spending $66K less than that period last year. Then they went from never having been profitable to consistent 20% net profit margins. This past month we exceeded total revenue for then entire 2025 calendar year in 30 days.
This wasn’t a single tactic, it was using the right playbook (with quality execution).
KPIs that matter: AOV expansion, products per order, shopping channel ROAS, catalog coverage (% of SKUs receiving traffic), top-20% SKU concentration.
KPIs that don’t: Single-creative ROAS without a denominator. A 5x ROAS on one ad means nothing if the catalog isn’t profitable as a whole.
Channel mix: Google Shopping 30-40%, Meta 30-40%, Google Search 20-25%, Pinterest 5-10%, TikTok 5-10%. Shopping becomes the primary channel because it solves the catalog-discovery problem at scale.
Creative cadence: 6-8 collection-specific ad sets per launch, with seasonal refreshes. Less volume than Q1, more organization. Collections most often beat individual products.
The merchandising infrastructure that has to exist: product feed optimization (DataFeedWatch), collection landing pages with filters, recommendation engines on PDPs (Nosto or LimeSpot), browse-abandon flows segmented by category, on-site search that surfaces inventory the customer didn’t know existed.
Tech stack signature: DataFeedWatch, Nosto/LimeSpot, Klaviyo with browse-abandon segmentation, Triple Whale, dynamic product ads in both Meta and Google Shopping.
Quadrant 3: The consideration brand (high ticket / low SKU)
Profile: $500-5,000+ AOV, 5-50 SKUs. Fitness equipment, jewelry, premium electronics, luxury goods.
Core challenge: Longer sales cycles plus trust-building required. The customer doesn’t decide in a session. They decide over weeks.
Growth driver: Educational content plus retargeting depth plus social proof plus financing.
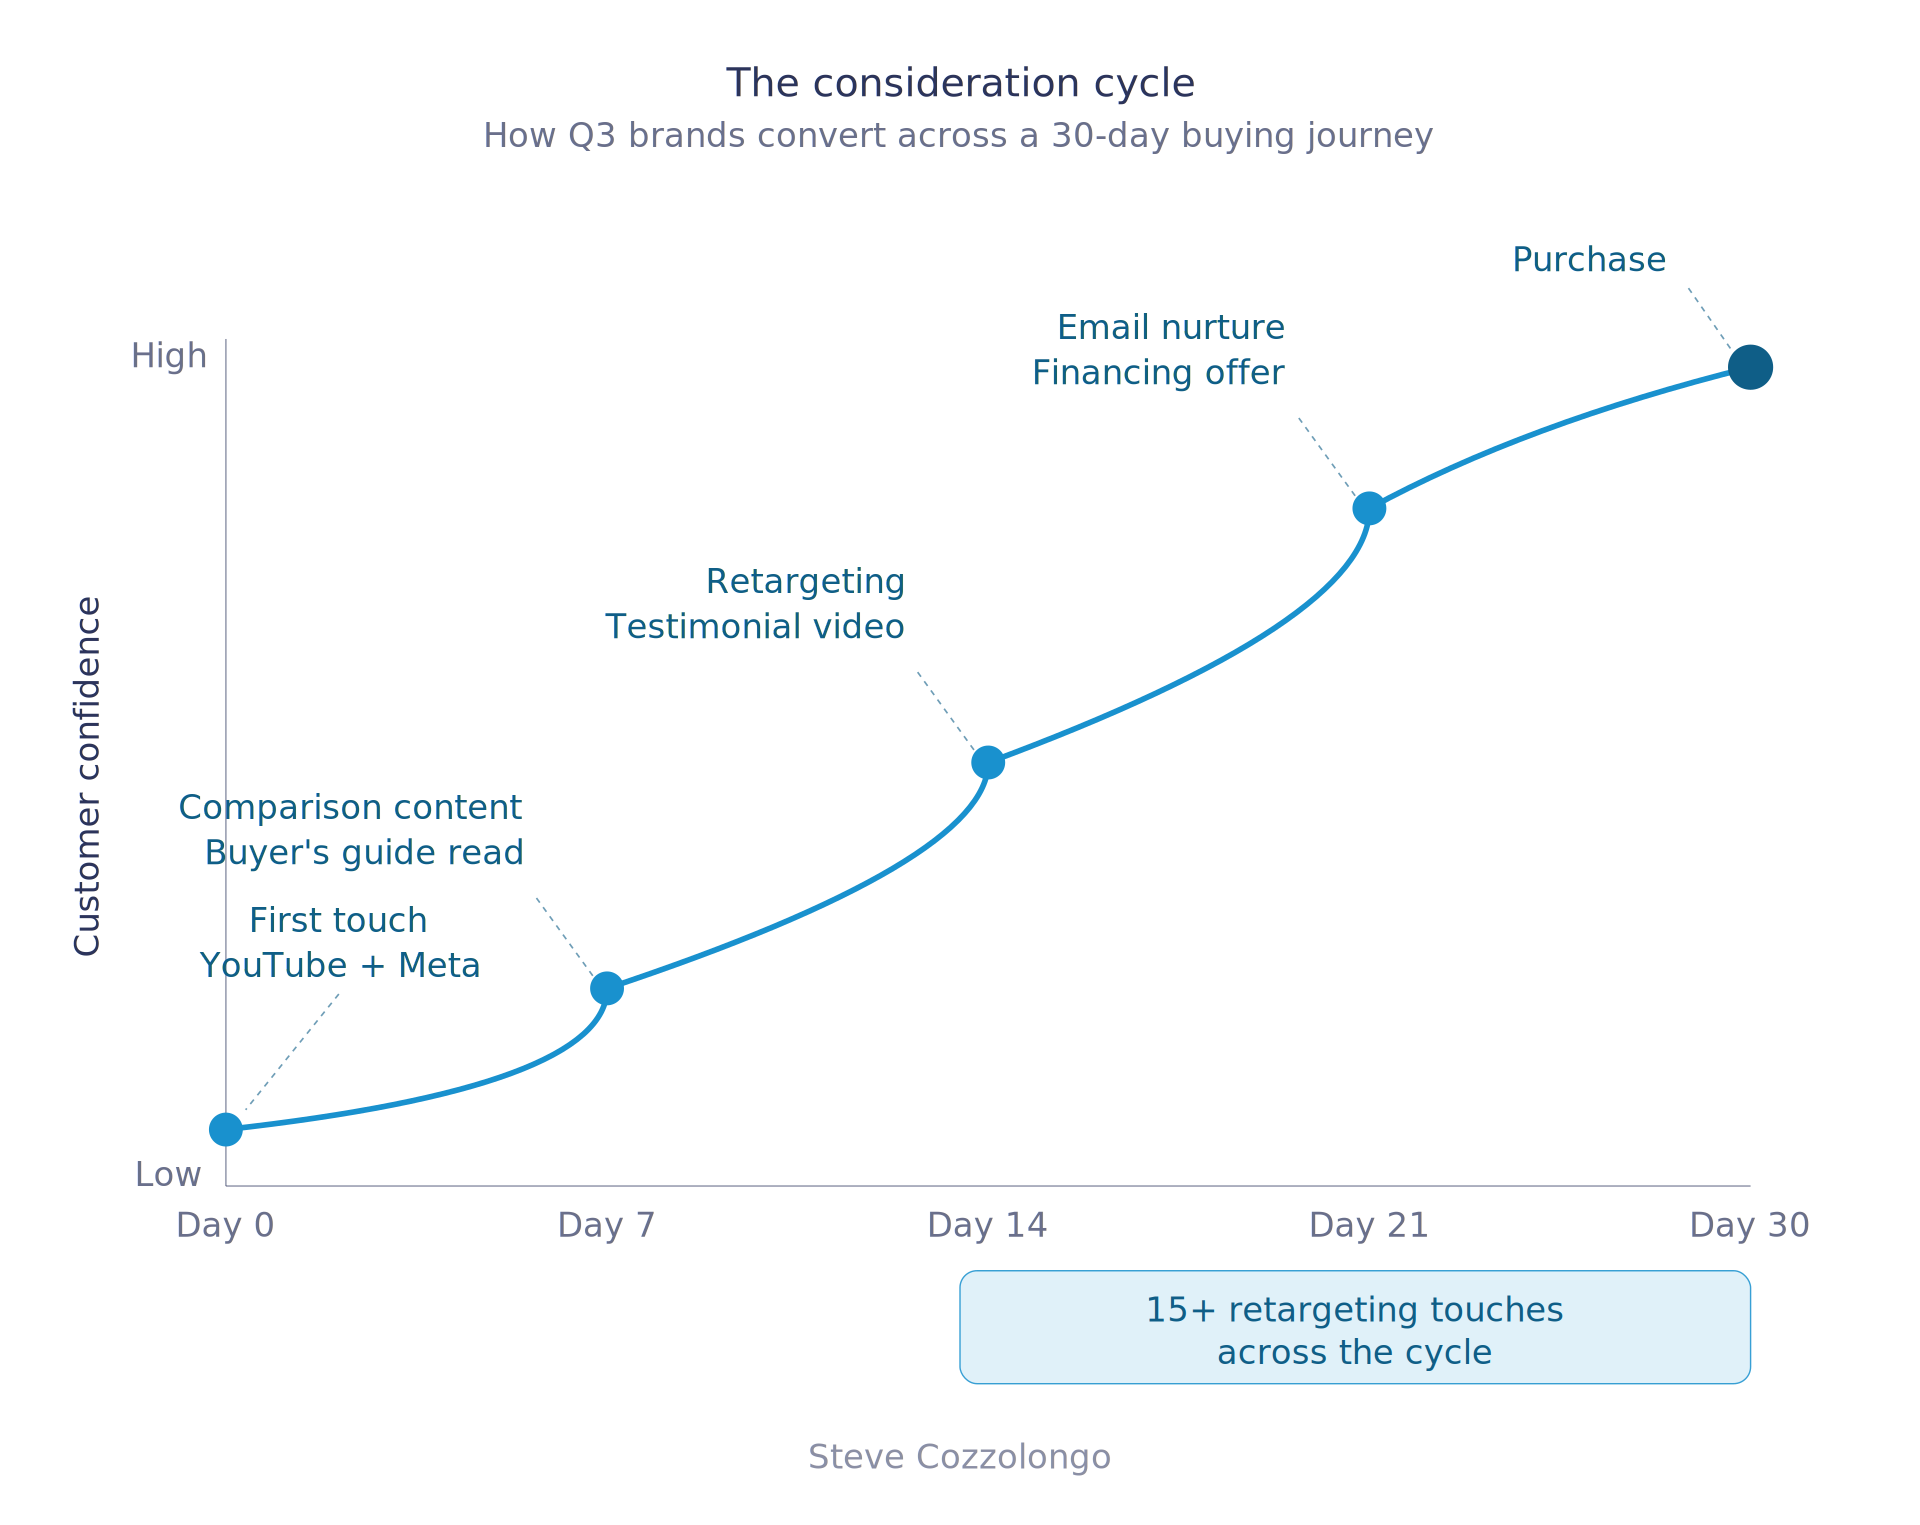
This quadrant is where most businesses fail. It’s also one of the hardest funnels because of the number of touchpoints. They run the consideration brand the same way they run a velocity brand. Broad prospecting, short attribution windows, “if it doesn’t give me a good enough ROAS in 7 days, kill it.”
When the buying cycle is 30+ days, a 7-day attribution window is worthless. You’ll kill the ad that sat in front of someone for two weeks while they considered, attribute the conversion to whatever last touched them on day 29, and shift budget toward the ad that “actually worked,” which is just the ad that got lucky on the closing impression.
Attribution on a 30-90 day buying cycle is the hardest puzzle to solve.
KPIs that matter: Average consideration time, retargeting contribution to conversions (typically 40-50%), review score and density (4.5+ stars, 50+ reviews per product), email nurture conversion rate, financing adoption rate.
KPIs that don’t: First-touch ROAS, single-creative performance in isolation, last-click attribution.
Channel mix: Meta 40-50%, Google Search 20-30%, Google Shopping 10-15%, YouTube 10-15%, TikTok 5-10%. YouTube becomes a primary channel because long-form is where consideration content actually gets consumed.
Creative cadence: 5-8 long-form videos (2-5 minutes) plus 15-20 short-form ads per quarter. The investment per asset is much higher. We’re talking professional product demos, customer testimonial films, expert comparison content.
The trust infrastructure that has to exist: structured review collection program, video testimonial library (8-10 customers minimum), financing integration (Affirm/Klarna/Afterpay), buyer’s guide content hub, comparison content vs. alternatives, consultation booking funnel for qualified leads.
Tech stack signature: Affirm or Klarna (financing), Calendly (consultation booking), Yotpo with video reviews, Triple Whale (extended attribution), Klaviyo with multi-email nurture sequences.
The structural shift here is attribution. A Q3 brand cannot operate on Meta’s in-platform attribution. We typically build a 30-60 day attribution window, run multi-touch attribution through Triple Whale, and reconcile against post-purchase surveys that ask “Where did you first hear about us?” after purchase.
CAC payback period of 60-90 days is acceptable in this quadrant.
Quadrant 4: The portfolio brand (high ticket / high SKU)
Profile: $800-10,000+ AOV, 100-1,000+ SKUs. Furniture, appliances, home improvement, luxury multi-category.
Core challenge: Complex buyer journeys plus inventory coordination plus long sales cycles. This is the hardest quadrant. It compounds the challenges of Q2 and Q3 simultaneously.
Growth driver: Search dominance plus guided selling plus showroom-to-digital plus financing.
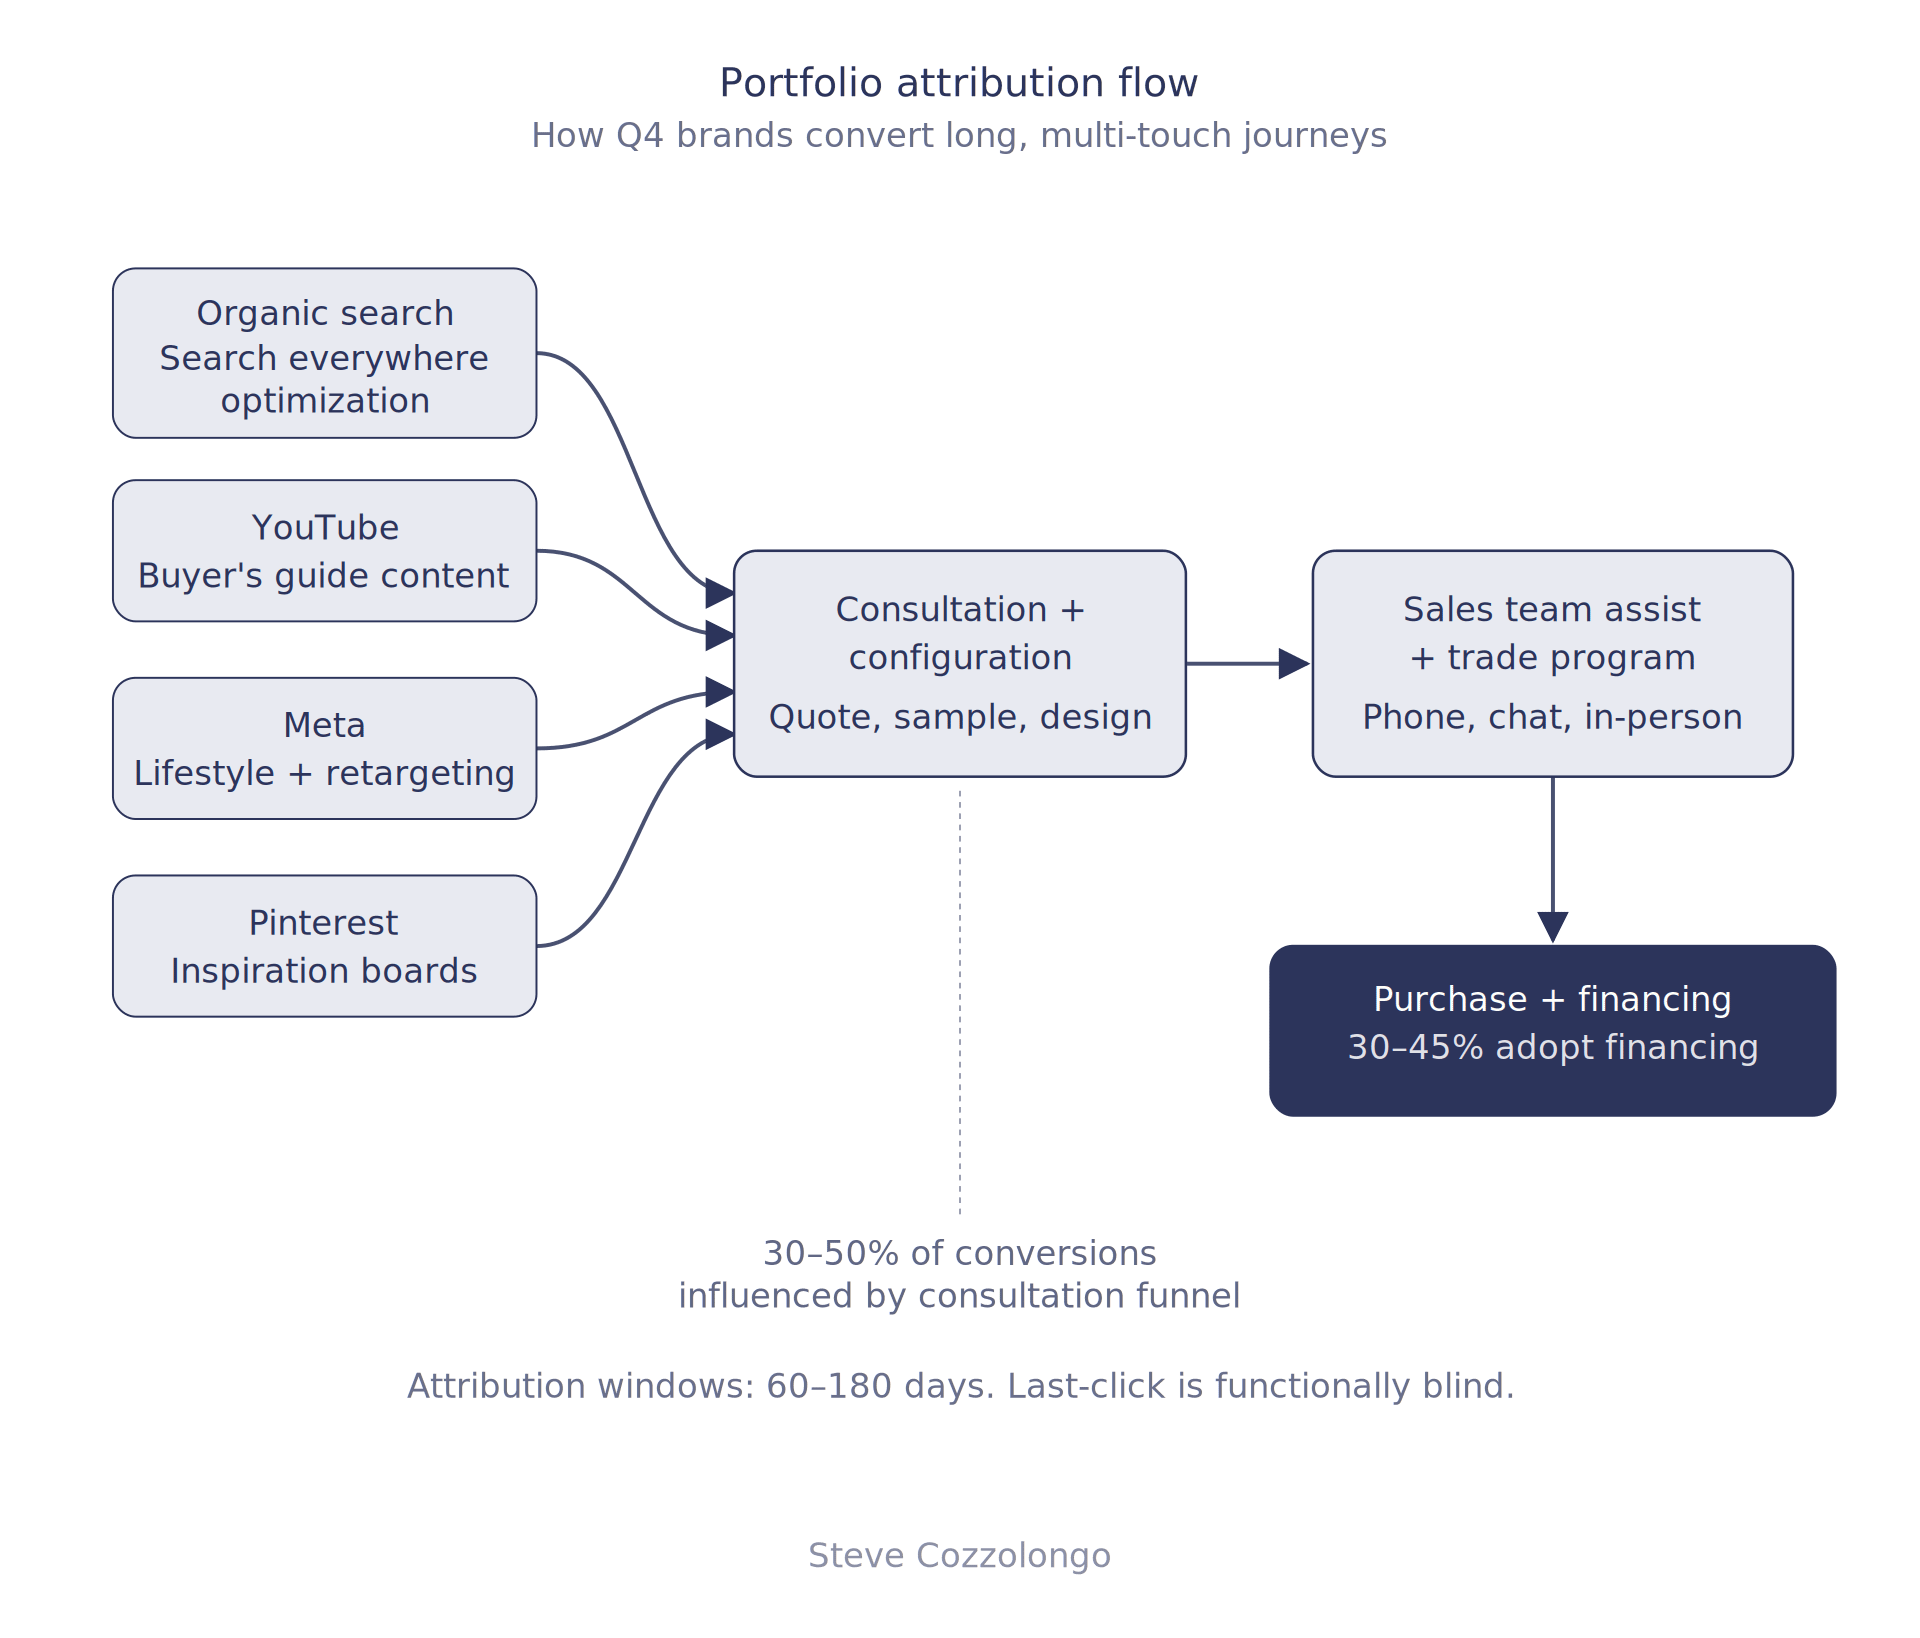
The portfolio brand wins on authority. Not just on ad creative. Not on a single channel. On being the answer when someone searches “best [category] for [use case].”
This is why SEO and AEO (Answer Engine Optimization) become the dominant channel mix here. The brands winning in 2026 are showing up in AI answers, Reddit threads, organic search, and YouTube.
A portfolio brand that isn’t visible in AI answers in 2026 is a portfolio brand that’s invisible to its highest-intent buyers.
KPIs that matter: Organic traffic share (target 35-50% of total), assisted conversions, consultation-to-sale rate (25-35%), financing adoption rate (30-45%), average sale cycle, branded search volume growth.
KPIs that don’t: Anything blended without a denominator. Anything that ignores assisted conversions. Last-click ROAS without a 60+ day attribution window.
Channel mix: Google Search 30-40%, Meta 25-35%, Google Shopping 20-25%, YouTube 10-15%, Pinterest 5-10%. Search is dominant because portfolio buyers research extensively before they ever click an ad.
Creative cadence: Content depth over volume. 10-15 buyer’s guides and category articles per month. 15-20 styled room/usage shots per quarter. 10-15 educational long-form videos per year. 360° product views for hero SKUs.
The authority infrastructure that has to exist: technical SEO foundation (site speed, schema, internal linking), content production engine (10+ articles/month), virtual consultation tools, AR/visualization (Threekit or Modelo), financing integration with prominent placement, sales team attribution tracking.
Tech stack signature: Semrush or Ahrefs, Peec (SEO), Threekit/Modelo (visualization), Affirm or in-house financing, Triple Whale (extended attribution and multi-channel reporting).
The portfolio brand we see most often gets miscategorized as a Q3. They run a consideration playbook, and ignore SEO/AEO. The reality is their catalog complexity demands the merchandising discipline of Q2 and the trust depth of Q3 and the search authority that’s unique to Q4. There is no shortcut. The investment is bigger and the timeline is longer.
CAC payback periods of 90-180 days are acceptable here. The brand needs to be the obvious choice when a customer is finally ready, six months after first contact.
Thanks for reading! Subscribe for free to receive new posts and support my work.
How the channel mix actually breaks down
Looking at all four quadrants side by side, the paid media allocation tells the whole story:
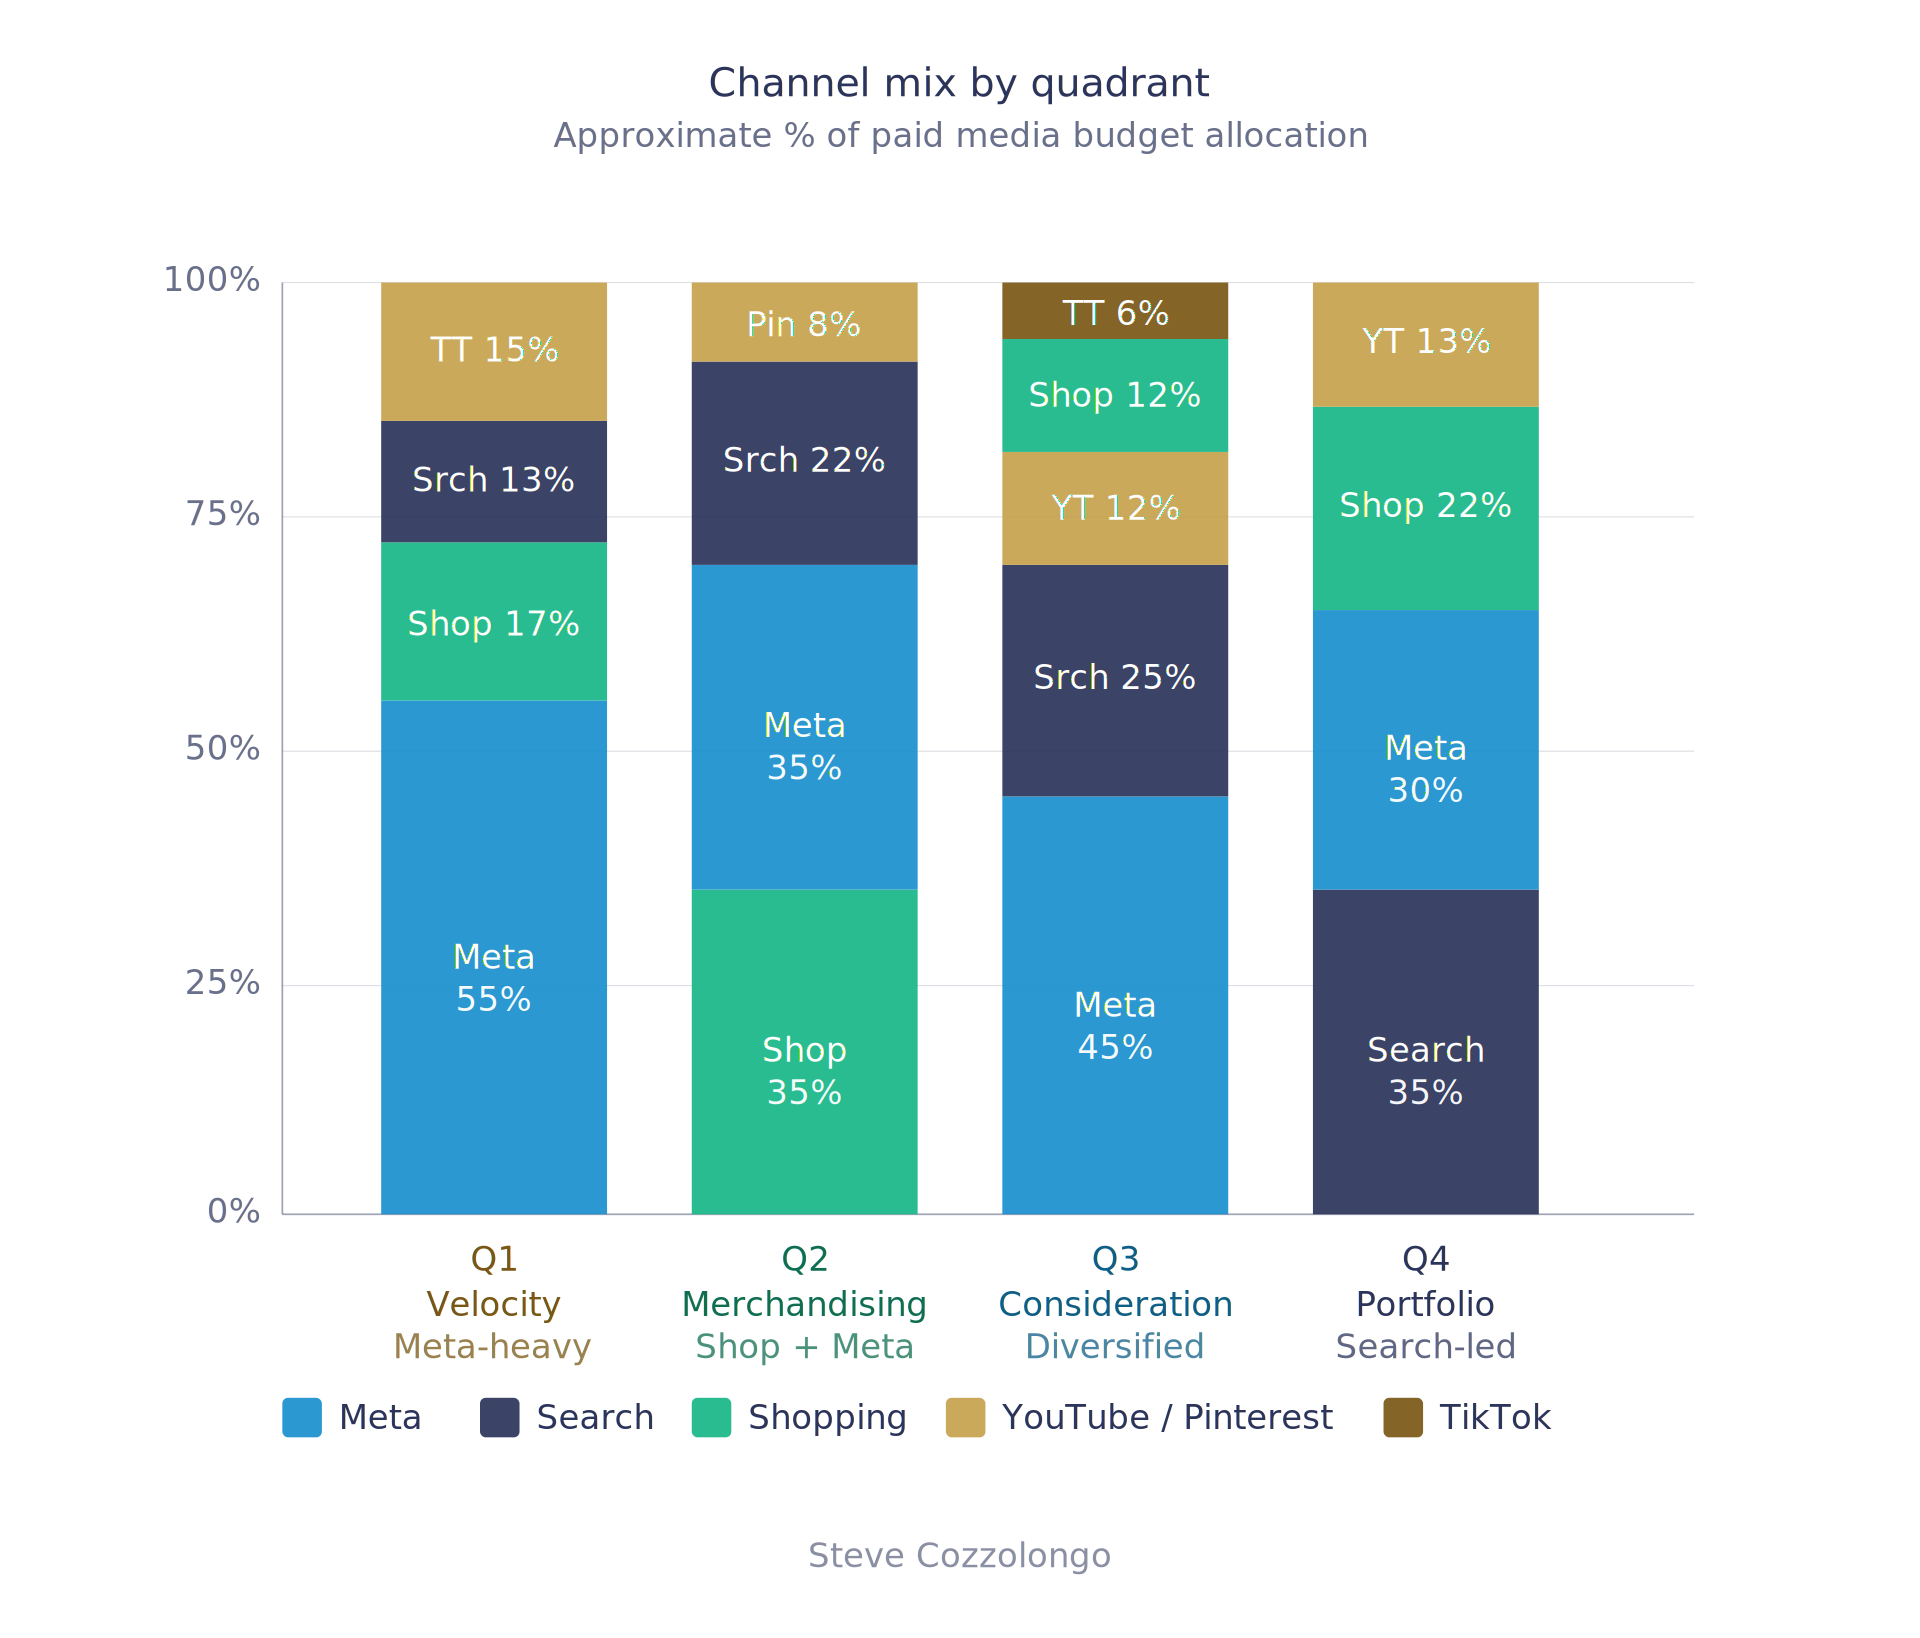
Each quadrant’s unit math dictates which channels can profitably absorb growth budget.
This is the single most expensive mistake we see when a founder switches agencies. The new team brings their preferred channel mix, but the brand needs a completely different one.
The 5-phase system that adapts to every quadrant
The quadrants tell us what to build. The phases tell us how and when to build it.
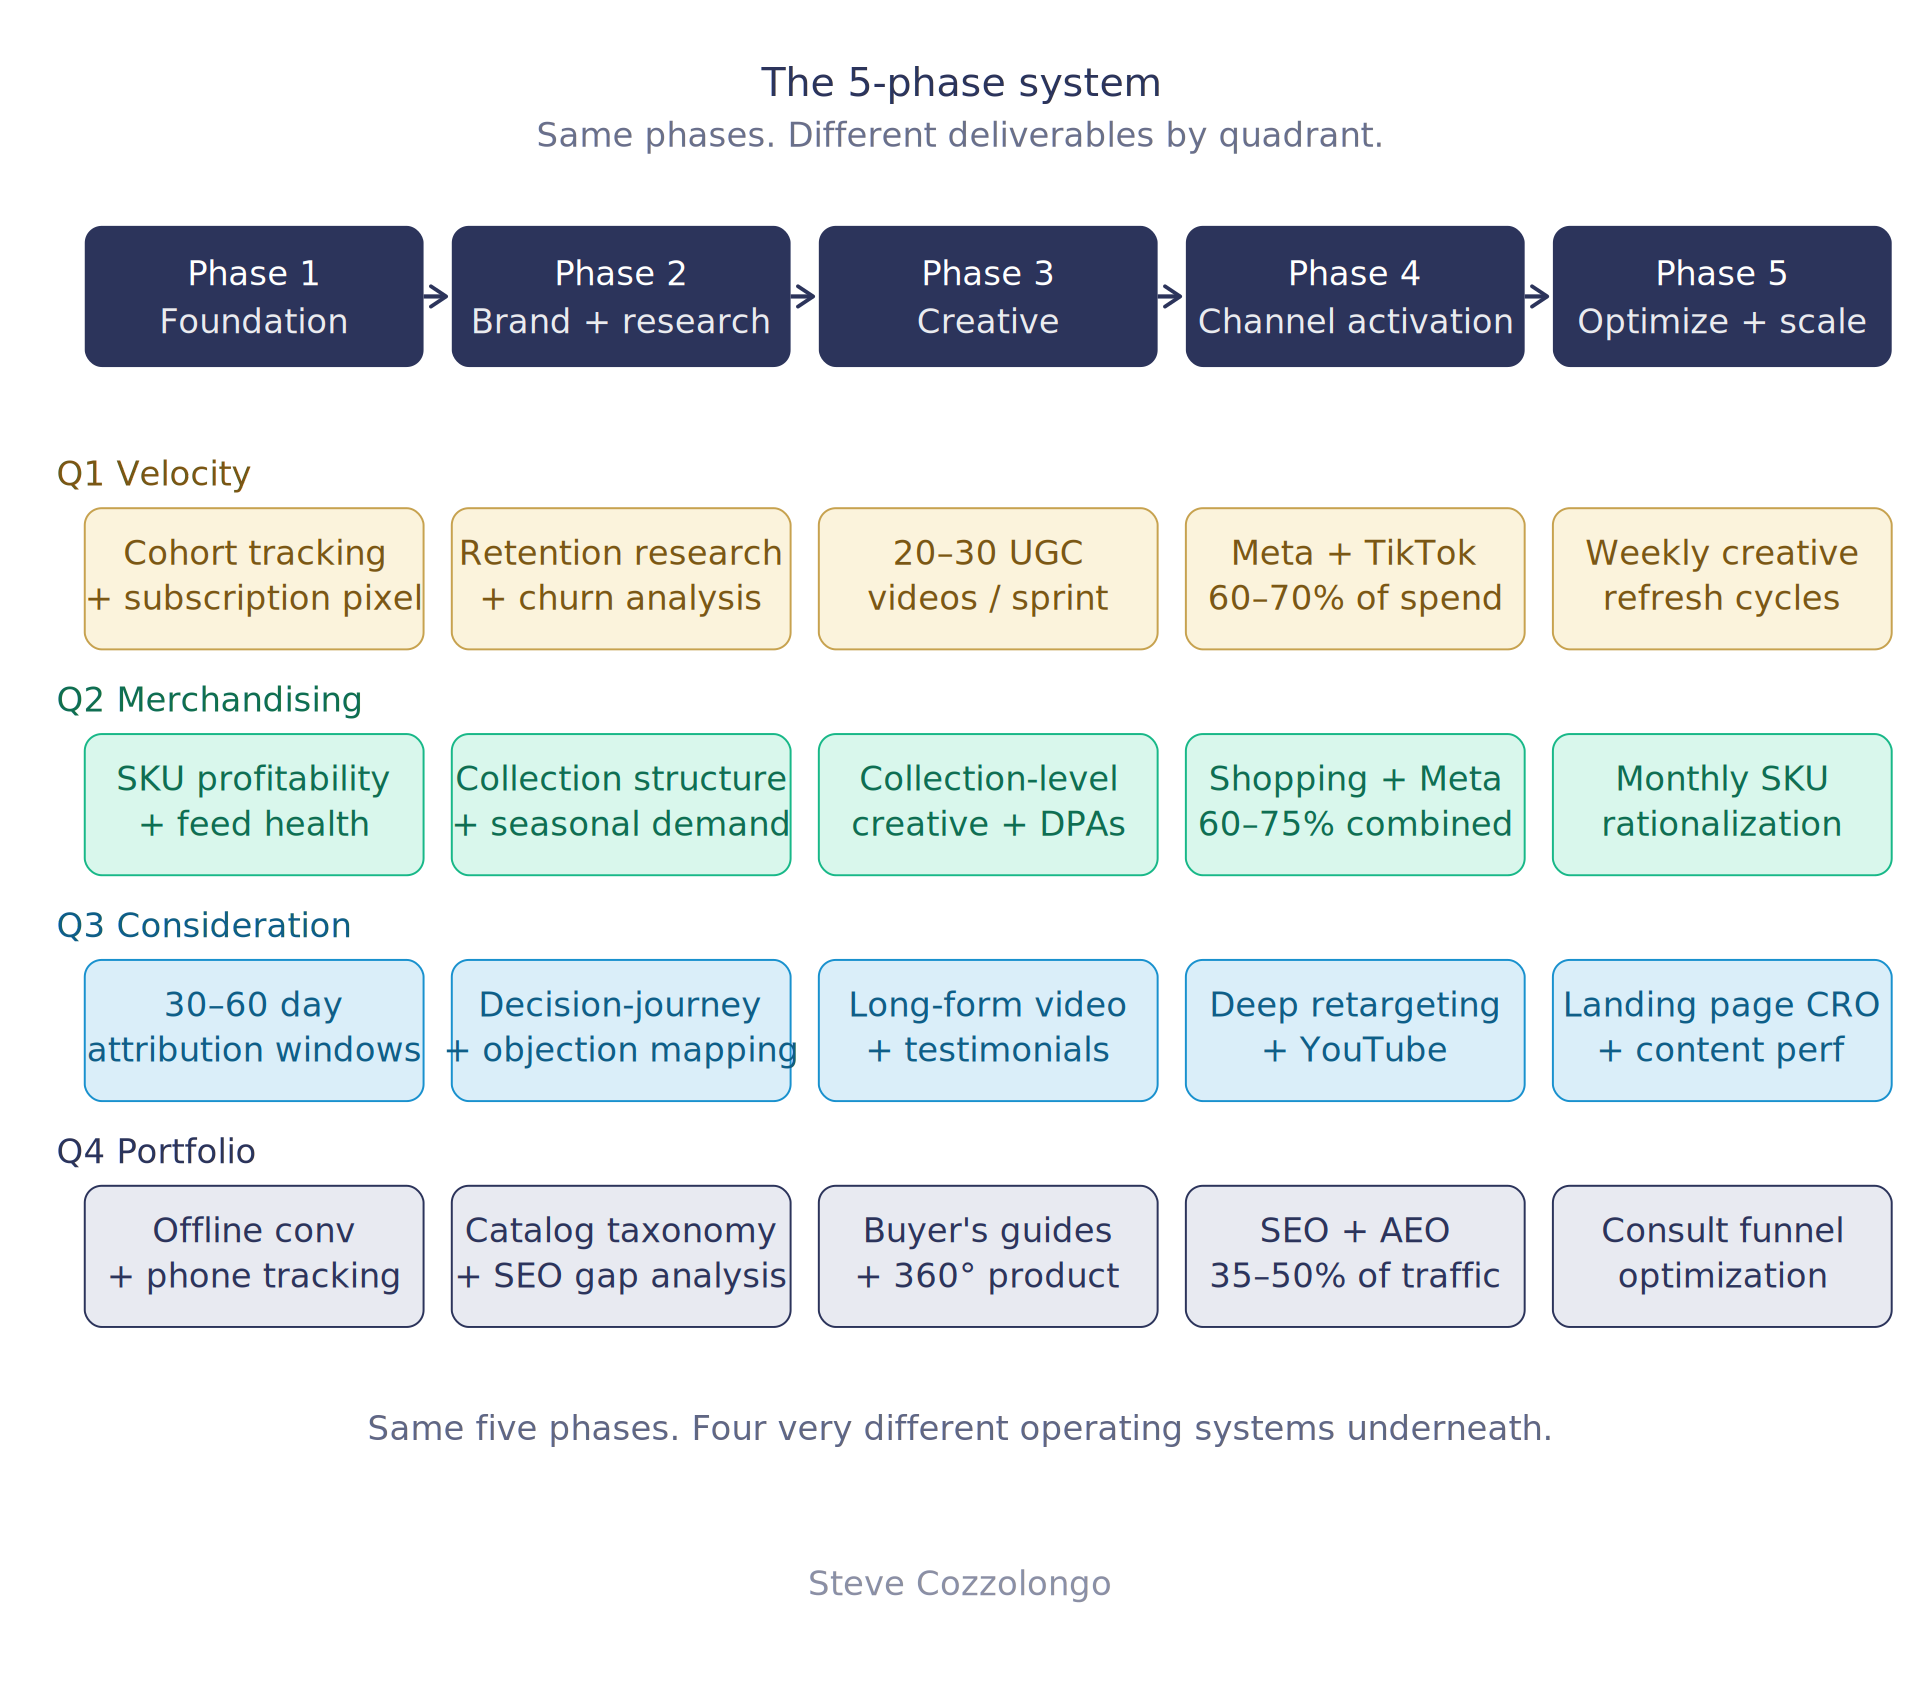
Every brand we work with goes through the same five phases.
Phase 1: Foundation (reporting and tracking). Server-side tracking, GTM, CAPI, MER dashboard, attribution model.
What changes by quadrant:
- A velocity brand needs cohort analysis built in (retention is the whole game).
- A merchandising brand needs SKU-level profitability tracking.
- A consideration brand needs 30-60 day attribution windows and lead scoring.
- A portfolio brand needs offline conversion imports, phone tracking, and sales team attribution.
Pro tip: After server-side tracking and CAPI implementation, Google Ads and Meta Ads revenue accuracy hits ~ 98%+ within ten days. Better platform data = better algo performance.
Bad data means you scale at the wrong times and cut at the wrong times. Phase 1 isn’t about the dashboard looking good. It’s about the dashboard telling the truth.
Phase 2: Brand and research. Buyer personas, competitor audit, messaging framework, customer interviews.
What changes by quadrant:
- Q1 emphasizes retention research and churn analysis.
- Q2 emphasizes product segmentation and seasonal demand planning.
- Q3 emphasizes decision-journey mapping and objection handling.
- Q4 emphasizes catalog taxonomy and competitive SEO gap analysis.
Phase 3: Creative strategy and production. Where the actual content gets built.
What changes by quadrant:
- Q1 produces 20-30 UGC videos per sprint with a 21-30 day refresh cycle.
- Q2 produces collection-based creative plus dynamic product ads.
- Q3 produces long-form educational video plus premium product photography plus customer testimonial films.
- Q4 produces room inspiration content, how-to videos, 360° product views, comparison guides.
Most brands focus on total ad spend rather than investing in content. It’s funny when brands say, “my budget is unlimited if I get the return” but they don’t want to invest $5k a month on creative and content. This boils my blood.
Phase 4: Channel activation. Launching the actual paid media, email, SEO, and partnership engine.
What changes by quadrant: Channel mix percentages, budget allocation, attribution windows, retargeting depth. We covered the per-quadrant breakdown above, but it’s worth saying explicitly: every quadrant uses every channel, but the weighting changes.
Phase 5: Optimization and scale. The ongoing layer where the magic happens.
What changes by quadrant: Reporting cadence, optimization focus, and team composition.
- Q1 needs weekly creative performance reviews.
- Q2 needs monthly SKU strategization.
- Q3 needs monthly content performance plus landing page CRO.
- Q4 needs ongoing SEO content production, funnel optimization, 3rd party mentions.
With one apparel client we work with, the Phase 5 layer added an SEO/AEO/Outreach play on top of an existing paid foundation, projecting traffic increases of 50% and revenue impact moving from $1.49M to $2.57M by adding a 1-point CVR lift to better-quality traffic.
How to diagnose your quadrant in five minutes
Every brand falls into one of these categories.
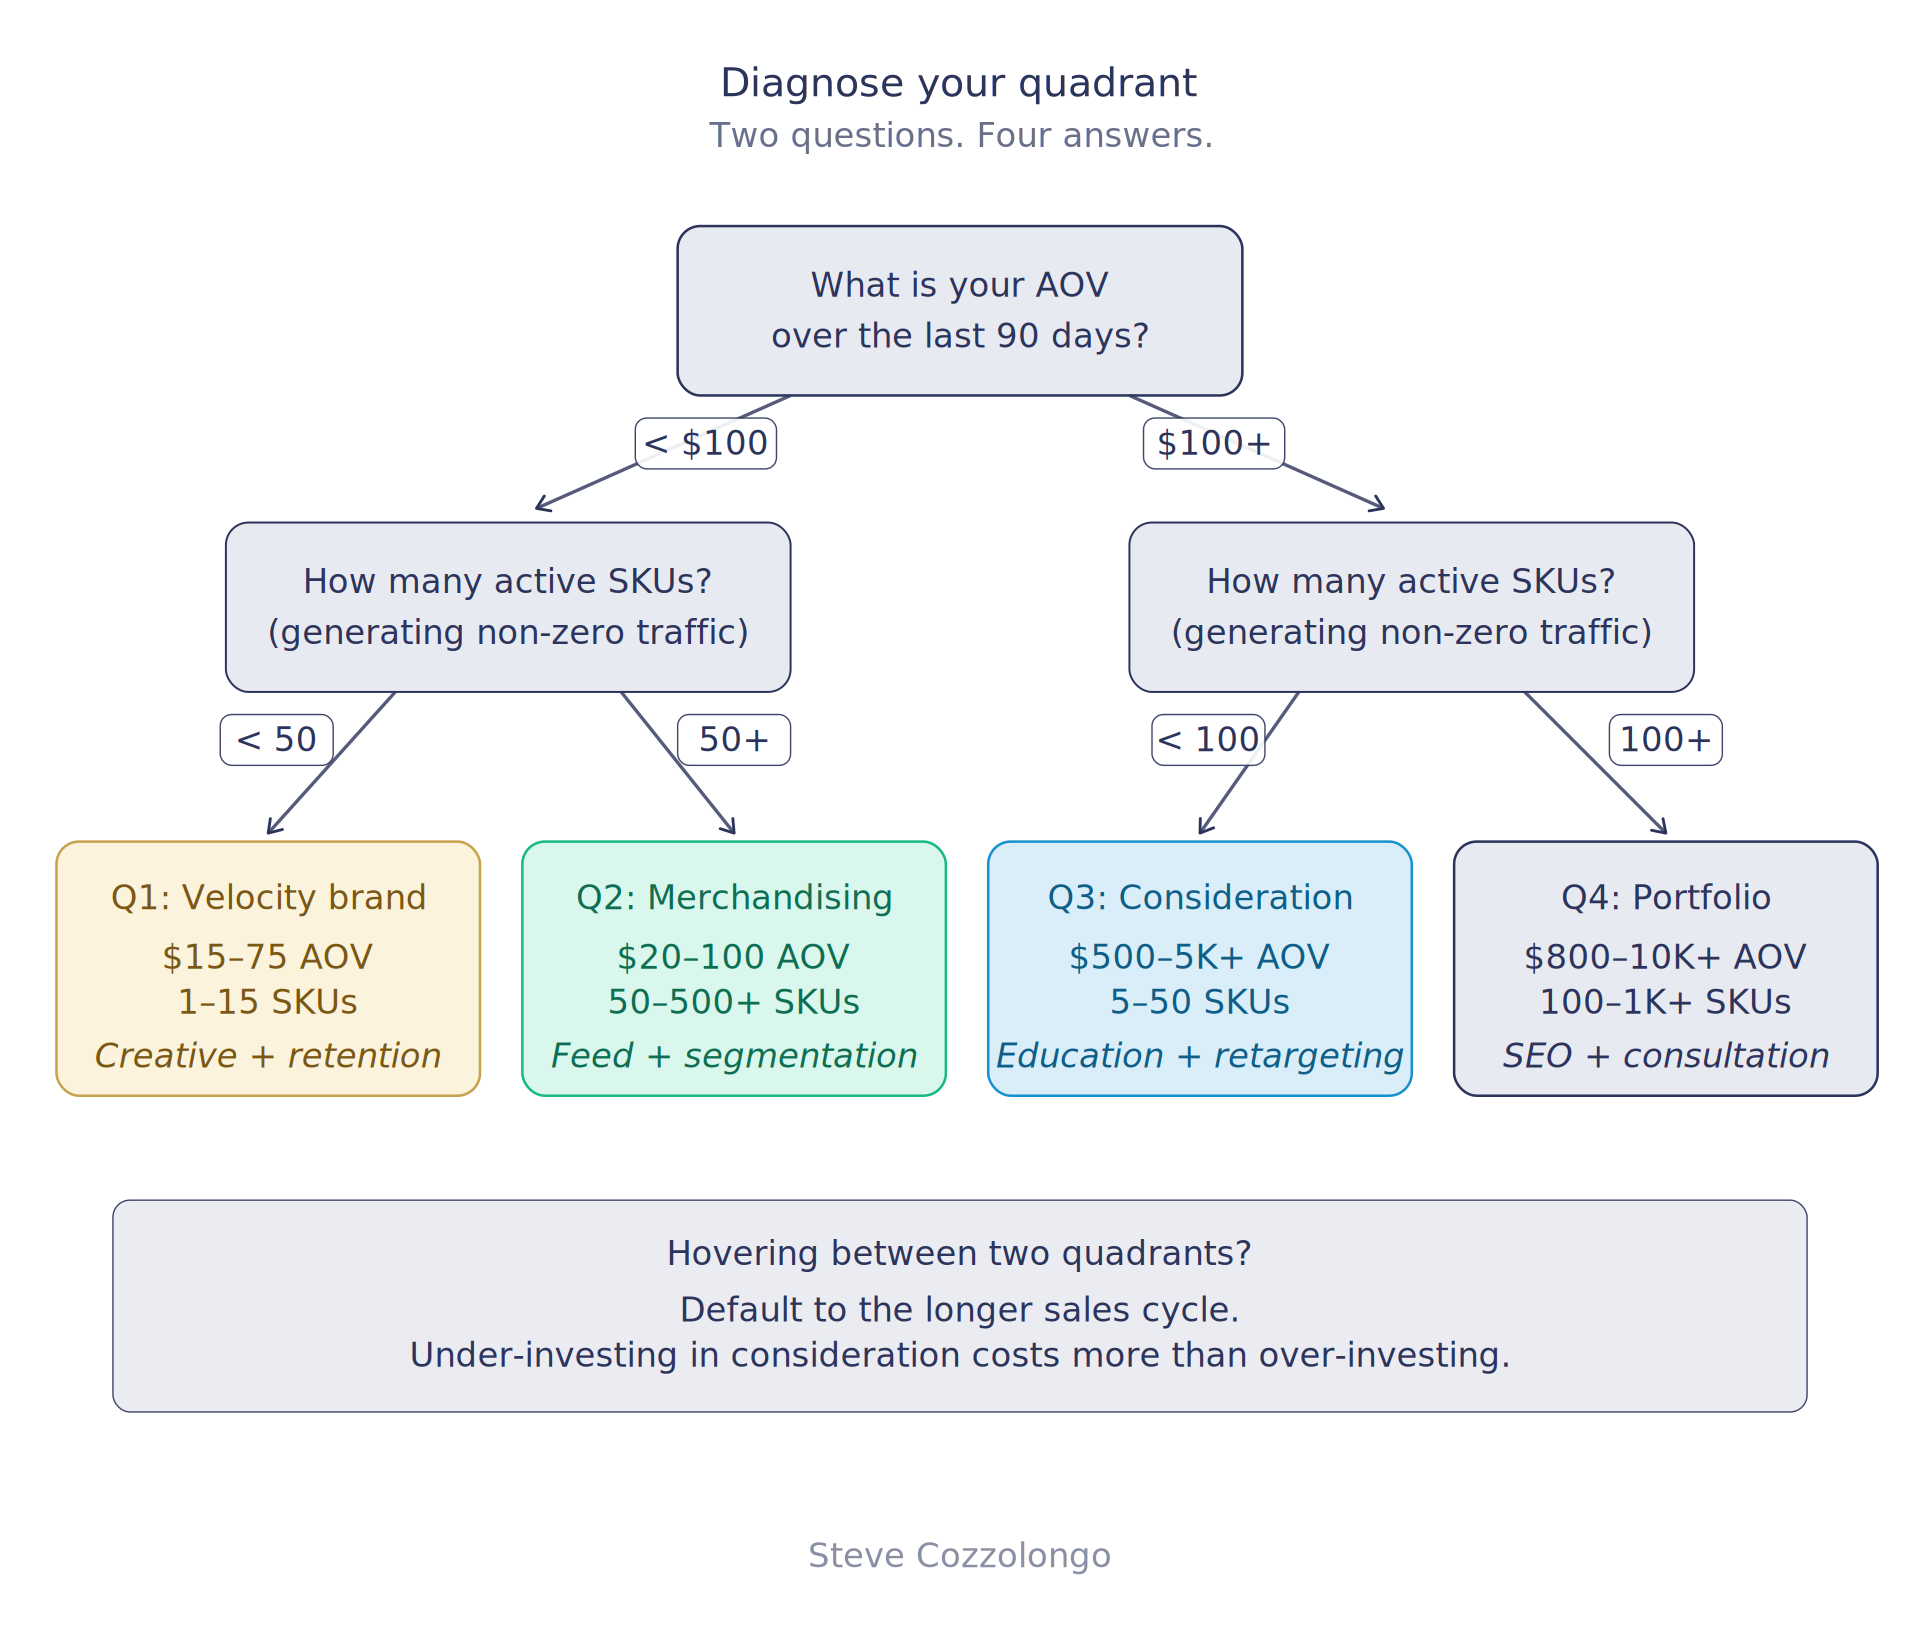
Two questions to answer:
1. What’s your average order value over the last 90 days? Below $100: left side of the matrix. $100 and above: right side. Men tend to be more impulsive than women which can change up your marketing strategy. (<$110 vs <$75)
2. How many active SKUs are you selling (i.e., generating non-zero traffic)? Under 25: bottom of the matrix. 100 or more: top.
That gives you your quadrant.
You may borrow strategies from multiple playbooks, but you will always have a foundation in 1 of the 4 quadrants.
A few common misdiagnoses we see:
A jewelry brand with 200 SKUs sometimes gets categorized as Q4 because of the high SKU count. But if the AOV is $200-400 and the buying cycle is 14 days, they’re almost always running a Q3 motion with a curated subset of hero products, not a Q4 portfolio strategy. The brand keeps the breadth on the site but invests against the top 20-30 SKUs.
A beauty brand with 8 SKUs at a $150 AOV looks like a Q1 (low SKU). But if the buying cycle involves comparison shopping, before/after content, and 30-day decision windows, they’re a Q3.
A furniture brand with 80 SKUs at a $1,200 AOV looks like Q3 by volume but is functionally Q4. Their buyers research for weeks across categories. They need the search authority and consultation funnel of a portfolio brand, even with a smaller SKU count, because the journey complexity matches Q4 not Q3.
When in doubt, default to the quadrant with the longer sales cycle.
Why this matters: the fastest way to scale is to stop running the wrong system
Most ecommerce brands obsess over ROAS while ignoring contribution margin. Most agencies optimize for the metric that’s easiest to report. And most playbooks get applied without ever asking the only question that actually matters: what kind of business is this?
A 5x ROAS means nothing if you’re spending it on low-AOV products with thin margins.
A 7-day attribution window means nothing on a 30-day buying cycle.
A Meta-first budget allocation means nothing on a Google-first business.
Get the diagnosis right, and every dollar of creative, every percentage point of budget allocation, every flow you build, every piece of content you create, becomes more efficient and has a purpose.

no replies