


How to Fix Conversion-Drops on Six-Figure Shopify Stores
Last Black Friday, we heard of a $20M fashion brand that lost $180K in 3 hours because their inventory checking widget couldn’t handle the traffic spike. Their checkout completion time jumped from 1.4s to 9.2s, and conversions dropped through the floor.
The culprit? A single external API call in checkout.liquid that began rate-limiting under load.
Performance failures during sales events can cost $50K-$500K+ in revenue within hours.
Most folks blame Shopify’s hosting when stores slow down during sales or traffic spikes.
While Shopify has plenty of flaws, when it comes to scalability, 9 out of 10 times, issues stem from accumulated technical debt in themes, apps, and vendor integrations, than Shopify infrastructure.
So, here’s how you can isolate the highest-risk bottlenecks before they impact revenue, focusing on the specific failure modes that emerge when traffic spikes expose hidden inefficiencies.
If You Only Do Three Things
Performance optimization can be overwhelming, especially with a sales event around the corner. If time and resources force you to prioritize, focus on these three actions that prevent the most costly failures:
| Priority | Action | Owner | Time Investment | Typical Impact |
| 1. Harden Your Checkout | Remove external API calls from checkout.liquid, migrate Scripts to Functions | Lead Developer | 1-2 weeks | 200-500ms improvement per session, prevents 6-15% conversion loss |
| 2. Test Vendors Under Load | Send traffic projections to critical vendors, demand performance SLAs, test APIs at 5x load | Head of Growth + Technical Lead | 3-5 days | Prevents $50K+ losses from vendor failures |
| 3. Assign Performance Ownership | One technical lead coordinates all readiness, owns emergency response | CTO delegates to Technical Lead | Ongoing coordination | Systematic preparation vs reactive firefighting |
Performance Risk Assessment
Rather than debugging reactively during live events, this assessment systematically identifies the highest-risk issues across your technology stack in 45 minutes total.
Strategic Risk Assessment
This 45-minute assessment prioritizes the issues most likely to cause six-figure revenue losses during traffic spikes, focusing on problems you can actually control.
Owner: CTO delegates to Lead Developer
| Assessment Area | Time | Red Flags | Immediate Action | Business Risk |
| Checkout Architecture | 15 min | External API calls in checkout.liquid, legacy Scripts >100ms execution | Remove API calls, migrate to Functions | 6-15% conversion loss during spikes |
| Vendor Dependencies | 20 min | >8 domains per page, vendors without performance SLAs | Consolidate domains, demand response time guarantees | 70% of failures stem from vendors |
| Capacity Planning | 10 min | Standard plan + >200 expected concurrent checkouts | Upgrade to Plus immediately | Standard caps at ~200 checkouts/min |
Technical Deep Dive Diagnostics
These diagnostic methods isolate the specific code and app issues that only surface under load, when fixing them during a live event becomes nearly impossible.
Owner: Lead Developer (30 minutes total)
| Analysis Type | Tool | Detection Method | Common Issues | Fix Priority |
| Theme Performance | Shopify Theme Inspector | Flame graphs showing >100ms blocks | Nested product loops, deprecated all_products usage | High – affects every page load |
| App Conflicts | Chrome DevTools Performance | Known pairs: Rebuy+Searchanise, Loox+Yotpo, Gorgias+Privy | Competing overlays, DOM injection conflicts | Medium – test disabling lower priority |
| Hidden Killers | Meta Pixel Helper, Tag Assistant | Duplicate GA4+Universal Analytics, anti-flicker snippets | 1-3 second content delays, cache bypasses | Medium – consolidate via Tag Manager |
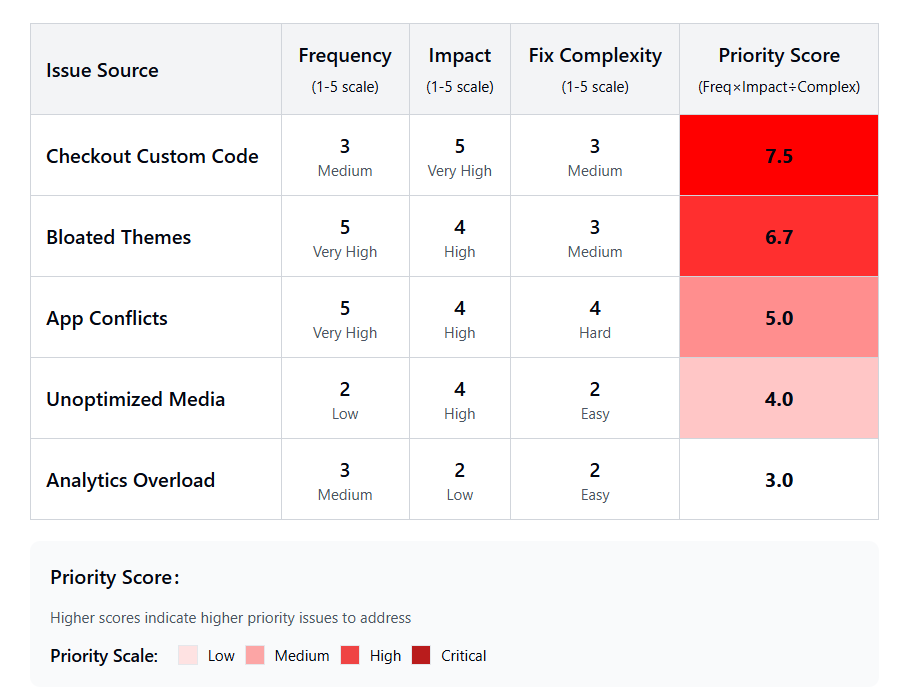
Documented Performance Issues
These real-world examples from $5M+ brands show how specific technical issues translate to measurable business impact. Use these patterns to identify similar problems in your own stack.
| Problem Category | Specific Example | Measured Impact | Resolution |
| App Conflicts | Rebuy + Searchanise competing cart overlays | Time to interactive degraded by 600ms | Disabled lower-priority app = 8.5% conversion improvement |
| Analytics Overload | GA4 + Universal Analytics running simultaneously | Doubled tracking calls, script execution bloat | Consolidated to single GA4 implementation |
| Theme Bottlenecks | Nested product tag loops in cart template | 124ms added to every cart render | Optimized Liquid logic, removed unnecessary loops |
| Anti-Flicker Issues | Google Optimize snippet blocking content | 1-3 second delay in First Contentful Paint | Disabled A/B tests during peak traffic periods |
Platform-Specific Performance Traps
Understanding how your platform choices create performance constraints helps prevent architectural decisions from becoming revenue limitations.
Shopify Plus Customization Risks
The performance paradox: checkout.liquid customizations boosting conversion by 2-3% under normal traffic can cause 11%+ conversion loss during peak events.
| Customization Type | Performance Impact | Symptoms | Executive Decision |
| checkout.liquid Logic | Dynamic logic executes synchronously per customer | TTFB jumps from 0.8s to 2s+ during checkout | Remove external API calls immediately |
| Legacy Scripts | Multiple Scripts create cumulative delays | 500ms+ added to checkout processing | Migrate to Functions (5ms vs unlimited execution) |
| Technical Debt | Code >12 months old from multiple developers | Deprecated patterns, external workarounds | Audit and remove pre-Functions solutions |
Plus-Specific Technical Debt Patterns
Plus stores accumulate performance debt over time as developers layer customizations without considering scale implications. These patterns emerge repeatedly in performance audits.
| Debt Category | Common Examples | Performance Impact | Detection Method |
| Deprecated Liquid | all_products usage for navigation/search | 20-product limit kills large catalog performance | Search theme files for all_products |
| Multiple Font Loads | 3-4 font families in checkout.liquid | Unnecessary seconds added to checkout rendering | Audit checkout.liquid for font imports |
| Pre-Functions Workarounds | External pricing APIs, inventory checks | Real-time API calls slow every request | Review customizations >12 months old |
| Zombie Code | Leftover includes from uninstalled apps | Still executes, slows page generation | Theme Inspector + manual code review |
Headless Architecture Reality Check
Headless promises are compelling, but the reality often disappoints unless you have dedicated performance engineering resources to rebuild what Shopify provides natively.
| Headless Promise | Reality | Business Risk | Decision Framework |
| Enhanced Performance | Often slower than optimized Shopify themes | Must rebuild CDN caching, bot protection, telemetry | Only proceed with dedicated performance engineering |
| Flexibility | GraphQL bottlenecks hit API rate limits | Cache misses = fresh API calls per user | Alternative: Optimize Online Store 2.0 (better ROI) |
| Personalization | Lose Plus bot protection during limited drops | Unfiltered traffic overwhelms real customers | Requires clear business requirements + technical capabilities |
Headless Failure Modes
Headless implementations promise better performance but often deliver the opposite. These failure modes only become apparent under traffic load when it’s too late to fix them.
| Failure Type | Technical Cause | Business Impact | Prevention |
| API Rate Limiting | Unoptimized GraphQL queries during spikes | PDPs stall, inventory becomes stale | Batch queries, implement retry logic |
| Cache Configuration | No edge caching = fresh API calls per user | 400ms to 1.5s+ TTFB increases | Use Cloudflare/Fastly/Oxygen for Hydrogen |
| Bot Vulnerability | Lost Plus bot protection features | Bots consume inventory during limited drops | Implement custom rate limiting |
| Bundle Optimization | Large JS bundles delay initial load | Worse performance than Liquid themes | Server-side rendering, code splitting |
Headless Readiness Assessment
Most brands underestimate what’s required for headless success. This assessment prevents costly migrations that result in worse performance than optimized Shopify themes.
| Requirement Category | Specific Needs | Assessment Questions | Go/No-Go Criteria |
| Technical Infrastructure | Edge caching, API optimization, monitoring | • Load tested Storefront API at 5x traffic? • Edge caching verified for dynamic content? • Checkout routes through native Shopify? | All systems tested and validated |
| Team Capabilities | Performance engineering, middleware expertise | • Dedicated performance engineering resources? • Strong observability practices? • 24/7 technical support coverage? | Yes to all, or stay with Online Store 2.0 |
| Business Justification | Clear requirements beyond native capabilities | • Multi-region personalization needs? • Complex content management requirements? • Integration demands beyond native apps? | Must have compelling business case |
Vendor Risk Management
Third-party services cause 70% of performance failures during sales events. Transform vendor relationships from potential failure points into revenue protection contracts.
Vendor Risk Tiers
Not all vendor failures are equal during sales events. This tier system ensures you focus emergency response efforts where they’ll protect the most revenue.
| Tier | Services | Failure Impact | Response Time | Testing Frequency | Emergency Protocol |
| Tier 1: Critical | Payment processors, core search, primary reviews | Direct conversion loss | <5 minutes | Monthly at 5x load | Immediate technical escalation to C-level contacts |
| Tier 2: Important | Analytics pixels, A/B testing, secondary tracking | Data loss, no UX impact | <30 minutes | Pre-event verification | Disable service, continue monitoring |
| Tier 3: Nice-to-Have | Chat widgets, social feeds, surveys | Minimal impact | <60 minutes | None required | Auto-disable at 3x traffic baseline |
Performance SLA Requirements
Standard vendor contracts protect their uptime, not your revenue. These SLA requirements shift accountability to vendor performance during your most critical business moments.
| SLA Component | Requirement | Contract Clause | Business Protection |
| Response Time | <200ms during peak traffic | Performance penalties = service credits/fee reductions | Prevents slow vendors degrading entire experience |
| Capacity Planning | Written confirmation for projected traffic | Vendor must notify load limits 30 days before events | Eliminates surprise capacity constraints |
| Emergency Support | Direct technical contact, <15 min acknowledgment | Dedicated escalation during designated sale periods | Enables rapid response during revenue-critical moments |
| Load Testing Rights | Ability to test APIs with advance notice | Documented fallback behavior at capacity limits | Validates vendor readiness before events |
Standard Vendor Questions
Most vendor contracts focus on uptime rather than performance. These questions expose performance gaps before they become revenue problems during your biggest sales events.
| Question Category | Specific Questions | Required Documentation | Red Flags |
| Performance Guarantees | • 95th percentile response times under 10x traffic? • Documented rate limits and burst handling? • Specific failover procedures? | Written performance SLAs, capacity documentation | Uptime-only SLAs, vague capacity answers |
| Emergency Support | • Direct technical contact (not general support)? • Response time guarantees during events? • Priority escalation protocols? | Emergency contact list, escalation procedures | General support only, no priority guarantees |
| Capacity Planning | • Can you handle our projected traffic? • 30-day advance notice of load limits? • Right to load test your APIs? | Capacity confirmation letter, testing agreements | Refusal to provide capacity data |
Script Consolidation Performance Budgets
Every third-party script adds execution time that compounds under load. These budgets prevent ‘death by a thousand cuts’ performance degradation.
| Page Type | Load Time Budget | Script Execution Budget | API Response Budget | Alert Threshold |
| Homepage | <2s total | <300ms third-party | <200ms vendor APIs | >2.5s sustained |
| Product Pages | <1.5s interactive | <200ms third-party | <200ms vendor APIs | >2s sustained |
| Cart Pages | <1s render | Zero blocking calls | <100ms | >1.5s sustained |
| Checkout | <1.5s completion | <500ms total custom | Zero external APIs | >2s sustained |
Common Script Violations
Third-party scripts accumulate silently over time as marketing teams add tools. These violations compound under load, turning minor inefficiencies into major bottlenecks.
| Violation Type | Examples | Performance Impact | Resolution Strategy |
| Multiple Chat Widgets | Gorgias + Intercom + Facebook Messenger | 200-400ms execution overlap | Consolidate to single solution |
| Duplicate Analytics | GA4 + Universal Analytics + Facebook Pixel duplicates | Doubled tracking calls, bloated execution | Single Tag Manager container |
| Heavy Recommendation Engines | Multiple product recommendation scripts | 300ms+ execution time | Lazy load or server-side rendering |
| Domain Proliferation | >8 unique third-party domains | DNS/SSL handshake overhead | Consolidate vendors where possible |
Pre-Event Vendor Coordination Protocol
Vendor failures during sales events are preventable with systematic preparation. This protocol ensures all critical services can handle your projected traffic before it arrives.
| Timeline | Activity | Owner | Deliverables | Success Criteria |
| 14 days out | Send traffic projections to Tier 1 vendors | Head of Growth | Traffic forecasts, peak concurrent user estimates | Written capacity confirmations within 72 hours |
| 10 days out | Schedule load testing windows | Technical Lead | Testing agreements, API access credentials | All critical APIs tested successfully |
| 7 days out | Verify emergency contacts and escalation procedures | Head of Growth + Technical Lead | Updated contact lists, escalation flowcharts | Emergency contacts confirmed responsive |
| 3 days out | Final vendor readiness confirmation | Technical Lead | Vendor readiness checklist, fallback procedures | All vendors confirm ready status |
Vendor Incident Response Matrix
During performance crises, knowing exactly who to contact at each vendor saves critical minutes. Response time requirements vary by the vendor’s impact on revenue.
| Vendor Type | Primary Contact | Response Time | Escalation Path | Fallback Procedure |
| Payment Processors | Technical account manager | <5 minutes | C-level vendor contact | Switch to backup payment method |
| Search/Reviews | Engineering support | <15 minutes | Account manager → Engineering | Display cached results, disable real-time features |
| Analytics/Tracking | Support tier 2 | <30 minutes | Disable service if no response | Continue with essential tracking only |
| Chat/Social | General support | <60 minutes | Disable during peak hours | Remove widgets, enable post-event |
Emergency Response Protocol
Performance issues during sales events require sub-2-minute detection and response. Pre-defined protocols prevent decision paralysis during revenue-critical moments.
Real-Time Alert Configuration
Standard monitoring tools miss revenue-critical signals until damage accumulates. These alerts detect problems before they show up in conversion rates.
| Alert Type | Trigger | Data Source | Response Time | Escalation |
| Revenue Impact | Revenue per visitor drops >5% (3+ min sustained) | Analytics + Shopify admin | 60 seconds | Technical Lead contacted immediately |
| Checkout Degradation | Completion rate drops >3%, time >2s (95th percentile) | Shopify Performance Dashboard | 60 seconds | Emergency vendor contacts |
| Technical Performance | LCP >2.5s mobile, vendor APIs >500ms, JS errors >1% | RUM monitoring + synthetic tests | 15 minutes | Development team response |
Traffic Quality Indicators
Revenue metrics lag behind technical problems. These leading indicators help detect performance degradation before it shows up in conversion rates.
| Metric | Normal Range | Alert Threshold | Indicates | Response |
| Session Duration | Baseline ±15% | >20% drop | Loading issues affecting engagement | Check page load times, disable heavy scripts |
| Bounce Rate (Revenue Pages) | Baseline ±10% | >15% increase on PDP/cart | Performance issues on critical pages | Emergency page optimization |
| Add-to-Cart Rate | Baseline ±5% | >10% decrease | Product page or cart functionality issues | Test cart functionality, app conflicts |
Emergency Response Sequences
Performance issues during sales events require sub-2-minute response times. These pre-defined sequences prevent decision paralysis when revenue is bleeding.
Tier 1: Revenue Drop >5% Detected (2-minute sequence)
| Step | Action | Time | Owner | Decision Point |
| 1 | Check checkout completion rates (most common cause) | 30 seconds | Technical Lead | If checkout OK, check vendor APIs |
| 2 | Disable non-essential scripts via Tag Manager | 2 minutes | Developer | Keep only payment, core analytics, fraud detection |
| 3 | Contact Tier 1 vendor emergency contacts with performance data | 3 minutes | Technical Lead | Provide specific metrics: response times, error rates |
| 4 | Campaign pause decision if no improvement | 15 minutes | Executive | Weigh continued revenue loss vs. traffic acquisition costs |
Tier 2: Technical Degradation (5-minute sequence)
| Step | Action | Time | Owner | Success Criteria |
| 1 | Rollback code changes from past 4 hours | 1 minute | Developer | Revert to last known good configuration |
| 2 | Disable checkout.liquid customizations, switch to native | 2 minutes | Developer | Restore native Shopify checkout flow |
| 3 | Escalate to vendors with specific data (response times, error rates) | 3 minutes | Technical Lead | All Tier 1 vendors contacted with metrics |
| 4 | Implement cached fallbacks for API-dependent features | 5 minutes | Developer | Essential features working without API dependencies |
Tier 3: Campaign Decision (15-minute evaluation)
| Decision Factor | Evaluation Criteria | Data Required | Decision Threshold |
| Revenue Impact | Continued loss rate vs. traffic acquisition costs | Revenue per minute vs. marketing spend | >$1000/minute loss = pause consideration |
| Customer Experience | Long-term brand impact vs. short-term revenue | Support ticket volume, social media sentiment | >2x normal support volume = pause consideration |
| Technical Recovery | Estimated time to resolution vs. event duration | Vendor response times, development capacity | >60 minutes to fix = strong pause consideration |
30-Day Implementation Timeline
Systematic preparation prevents performance failures through coordinated technical and business readiness with measurable outcomes at each stage.
| Week | Owner | Priority Tasks | Success Criteria | Time Investment |
| Week 1: Assessment | CTO + Head of Growth | • Run 45-min risk assessment • Vendor SLA review and tier classification • Send traffic projections to Tier 1 vendors • Assign dev resources and incident response team | • All technical debt identified • Written vendor capacity confirmations • Emergency contacts verified | 8-12 hours |
| Week 2-3: Remediation | Lead Dev + Senior Dev | • Checkout hardening (migrate Scripts to Functions) • Remove external API calls from checkout.liquid • Fix theme Liquid blocks >100ms • Resolve app conflicts, consolidate tracking | • 200ms+ checkout improvement • Zero external APIs in checkout • App conflicts resolved • Single Tag Manager container | 40-60 hours |
| Week 4: Validation | DevOps + Tech Lead | • Load testing under 5x traffic • Vendor API capacity testing • Configure real-time monitoring alerts • Test incident response procedures | • 5x traffic validation passed • All vendor APIs tested • Business impact alerts configured • Emergency protocols tested | 16-24 hours |
Success Metrics
Revenue Protection KPIs (monitor in real-time during events):
| Metric | Target | Alert Threshold | Business Impact |
| Revenue per visitor | Within 5% of baseline during 3x traffic | >5% drop for 3+ minutes | Direct revenue loss measurement |
| Checkout completion time | <1.5s (95th percentile) | >2s sustained | Conversion impact indicator |
| Conversion rate | <3% drop at peak concurrency | >3% drop from baseline | Overall funnel health |
Technical Performance Thresholds:
| System | Normal Performance | Peak Performance Target | Alert Threshold |
| Time to First Byte | <600ms | <800ms all revenue pages | >1.5s sustained |
| Third-party script execution | <200ms | <300ms total per page | >500ms sustained |
| Vendor API response times | <150ms | Within contracted SLA during load | >500ms sustained |
Post-Event Analysis Protocol
Learning from each event improves future performance readiness. This analysis framework turns performance data into actionable vendor and technical improvements.
| Timeframe | Analysis Type | Key Questions | Output |
| Within 24 hours | Technical forensics | • Which optimizations held vs failed? • Revenue loss by time period and source? • Vendor performance vs SLAs? | Performance attribution report |
| Within 1 week | Strategic review | • Which vendors need contract renegotiation? • What technical debt emerged? • Technology investment priorities? | Updated vendor risk tiers, technical roadmap |
Vendor Renegotiation & Technical Roadmap Updates
Each performance event generates valuable data for improving future readiness. This framework turns post-event analysis into strategic decisions about vendor relationships and technology investments.
| Review Area | Analysis Framework | Decision Criteria | Output |
| Vendor Relationships | Grade performance vs SLA commitments | Renegotiate with vendors scoring <80% | Updated contracts with performance penalties |
| Technical Roadmap | ROI analysis of measured performance impact | Prioritize optimizations with >$10K revenue protection | Quarterly performance audit schedule |
| Technology Investments | Headless vs Plus upgrade vs theme optimization | Base decisions on actual performance data vs assumptions | Strategic technology plan |
Real-Time Monitoring Stack
Effective monitoring requires different dashboards for executives making business decisions versus technical teams implementing fixes.
Executive Dashboard (Business Metrics)
Executives need different metrics than technical teams during events. This dashboard focuses on business impact rather than technical details.
| Metric | Data Source | Update Frequency | Decision Trigger |
| Live revenue per minute vs baseline | Analytics + Shopify admin | Real-time | >5% variance sustained |
| Conversion rate by traffic source | Analytics segmentation | 5-minute intervals | Source-specific degradation |
| Geographic performance variance | CDN analytics | 10-minute intervals | Regional slowdowns |
| Vendor performance scoreboard | API monitoring | Real-time | SLA violations |
Technical Dashboard (Developer Implementation)
Technical teams need granular diagnostic data to implement fixes quickly. This monitoring stack provides the specific metrics needed for rapid problem resolution.
| System | Purpose | Alert Configuration | Response Protocol |
| Shopify Performance Dashboard | TTFB spikes, Liquid render time | >20% degradation from 7-day average | Immediate theme investigation |
| Real User Monitoring (SpeedCurve + Shopify) | Time to Interactive, FCP by geo/device | >20% degradation sustained | Device/location-specific optimization |
| Synthetic Monitoring (Pingdom) | Critical flow testing every 60s | >3s load time or HTTP errors | Emergency response activation |
Vendor Performance Attribution
Attributing performance problems to specific vendors provides contract renegotiation leverage and helps prioritize vendor relationships.
| Monitoring Type | Metrics Tracked | Alert Thresholds | Business Value |
| Script Performance | Individual vendor script execution times | Any script >100ms execution | Identify slowest vendors for optimization |
| API Dependencies | Response times for reviews, search, personalization | >500ms response time, >1% error rate | Predict vendor failures before customer impact |
| SLA Compliance | Uptime and performance during high-traffic periods | Violations of contracted performance metrics | Contract renegotiation leverage |
Monitoring Tool Recommendations
Different monitoring tools serve different purposes during performance events. This stack provides both executive visibility and technical diagnostic capability.
| Tool Category | Recommended Solution | Purpose | Cost Considerations |
| Real User Monitoring | SpeedCurve + Shopify native Performance Dashboard | Actual customer experience metrics | $200-500/month depending on traffic |
| Synthetic Monitoring | Pingdom or GTmetrix | Consistent testing from multiple locations | $100-300/month |
| Business Analytics | Enhanced Analytics + Google Analytics 4 | Revenue and conversion correlation | Native to platforms |
| Vendor Monitoring | Custom API monitoring + status page aggregators | Third-party service health | $50-200/month |
Response Effectiveness Benchmarks
Fast response times during performance events directly correlate with revenue protection. These benchmarks help evaluate and improve your incident response capabilities.
| Response Metric | Target | Measurement Method | Improvement Actions |
| Alert acknowledgment | <60 seconds | Time from alert to first response | Improve notification methods, dedicated on-call |
| Emergency fix implementation | <5 minutes | Time from decision to deployed fix | Pre-prepared emergency fixes, automated deployments |
| Vendor escalation completion | <10 minutes | Time to reach technical contacts at all Tier 1 vendors | Updated contact lists, multiple communication channels |
| Campaign pause decision | <15 minutes | Time from revenue impact to traffic reduction | Clear decision criteria, executive availability |
Success Indicators
Measuring incident response effectiveness helps improve performance readiness over time. These indicators distinguish high-performing teams from those that rely on luck.
| Metric | Excellent | Good | Needs Improvement |
| Issues resolved without campaign pause | >90% | 75-90% | <75% |
| Revenue recovery time after fix | <5 minutes | 5-15 minutes | >15 minutes |
| Vendor SLA compliance during events | >95% | 85-95% | <85% |
| Customer impact minimization | Session quality unchanged | <10% degradation | >10% degradation |
This systematic approach transforms performance management from reactive firefighting into proactive revenue protection, ensuring your biggest sales opportunities aren’t undermined by preventable technical failures.
Where to go From Here
Effective revenue protection follows a simple pattern. Before any major technical decision – whether it’s adding a new app, customizing checkout, or choosing between platform options – ask yourself three questions:
1. “What breaks first under 5x traffic?
This forces you to think about failure modes rather than features. That inventory widget that boosts conversion by 2% might cost you 15% when traffic spikes and the API rate-limits. The personalization engine that delights customers becomes a liability when it bypasses caching. Always evaluate technical decisions through the lens of scale, not just functionality.
2. Who controls the fix?
Prioritize risks you can control over those dependent on vendors. You can rollback your own code in minutes. You can’t force a vendor to scale their infrastructure during your biggest sales event. This is why checkout customizations and vendor dependencies rank highest in the risk assessment – when they break, your recovery time depends entirely on other people’s priorities.
3. What’s the revenue recovery time?
Focus on issues that can be fixed in minutes, not hours. A misconfigured Script can be disabled instantly. A failing vendor API might take hours to resolve. An overloaded headless implementation could require architectural changes. The faster you can recover, the higher priority the risk should be in your preparation.
The 80/20 Rule for Performance
80% of revenue protection comes from hardening checkout and testing your top 3 vendors. Everything else is optimization.
Most brands get distracted by image compression and theme tweaks while ignoring the fact that their payment processor hasn’t confirmed capacity for Black Friday traffic. Master the fundamentals first: checkout reliability and vendor accountability. Advanced optimizations matter, but they don’t matter more than the basics.
Performance isn’t about having the fastest site – it’s about having the most resilient revenue engine. When your biggest opportunities arrive, that resilience becomes the difference between record-breaking sales and expensive lessons.
If your next big sale is riding on assumptions and untested systems, you’re gambling with revenue. A 30-minute discovery call could reveal which hidden bottlenecks would crack first under 5x traffic – and what to do about them before it costs you six figures.Book a free discovery call to get help from our specialists. No fluff. Just fast, actionable insight.


)
no replies